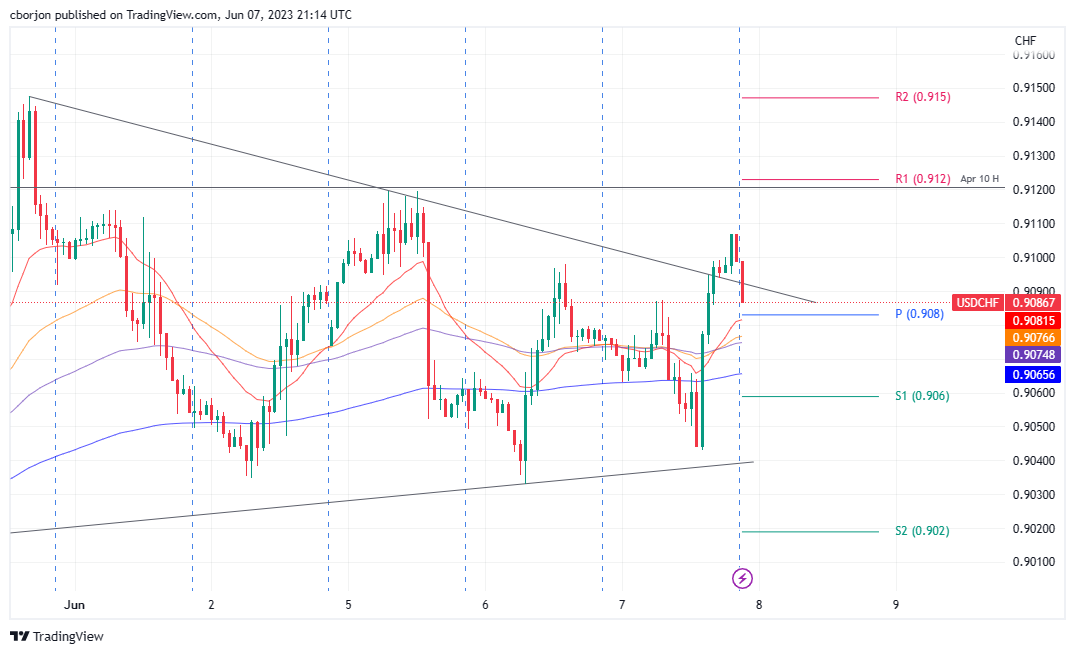
- USD/CHF shows bullish momentum, targeting the 0.9100 mark with 0.27% gains.
- RSI and three-day RoC indicators suggest bullish dominance despite sideways movement.
- Overcoming the 0.9120 hurdles could steer the USD/CHF toward the 0.9147 and 0.9200 landmarks.
USD/CHF bounces off the 50-day Exponential Moving Average (EMA) and threatens to claim the 0.9100 figure late after Wall Street closed. The US Dollar (USD), propelled by risk aversion, helped the USD/CHF to Regusters solid gains of 0.27%. At the time of writing, the USD/CHF is trading at 0.9090 after hitting a low of 0.9043.
USD/CHF Price Analysis: Technical outlook
From the USD/CHF daily chart perspective, the pair is neutrally biased, consolidated within the limits of solid support found around the 20- and 50-day EMAs, each at 0.9036 and 0.9040) and resistance at the 100-day EMA at 0.9123. Although price action remains sideways, the Relative Strength Index (RSI) shows bulls are in charge, further cemented by the three-day Rate of Change (RoC). Hence, the USD/CHF path of least resistance is upwards. Of note, the Average True Range (ATR) suggests that volatility in the pair could lean up to 60 pips.
Dialing into the USD/CHF hourly chart, price action remains sideways, though it broke above a resistance trendline late in the New York session, exacerbating a rally above 0.9100. However, buyers must reclaim the weekly high of 0.9120, so they can pose a threat toward the last week’s high of 0.9128. The breach of those levels will pave the way towards the R1 daily pivot at 0.9147, ahead of challenging the 0.9200 figure. Conversely, a fall below the daily pivot at 0.9083 could open the door towards the EMAs at around 0.9074/76, followed by the 200-EMA at 0.9065.
USD/CHF Price Action – Hourly chart
- SEO Powered Content & PR Distribution. Get Amplified Today.
- EVM Finance. Unified Interface for Decentralized Finance. Access Here.
- Quantum Media Group. IR/PR Amplified. Access Here.
- PlatoAiStream. Web3 Data Intelligence. Knowledge Amplified. Access Here.
- Source: https://www.fxstreet.com/news/usd-chf-price-analysis-jumps-strongly-off-50-day-ema-sets-sights-on-09100-202306072115


