Business intelligence reporting is a critical component of any organization’s operations. It entails collecting, analyzing, and presenting data to support informed decision-making. In today’s fast-paced business environment, it is imperative for organizations to have access to accurate and relevant data to make strategic decisions that drive growth and success. Business intelligence reporting tools enable organizations to gather and analyze data from various sources and present it in a meaningful and actionable manner.
What is business intelligence reporting?
Business intelligence reporting refers to the process of collecting, analyzing, and presenting data to support informed decision-making in an organization. This often includes creating and delivering reports, dashboards, and other visualizations that help managers and other stakeholders understand key performance indicators, trends, and other important business data. Business intelligence reporting can be used to support a wide range of business activities, from financial analysis and budgeting to marketing and customer relationship management.
Standard reports in business intelligence
Standard reports in business intelligence are predefined, regularly-used reports that provide key performance indicators (KPIs) and other important data to help managers and other stakeholders make informed decisions. These reports are typically created using business intelligence software and can be run on a regular schedule, such as daily, weekly, or monthly.

What are the different types of business intelligence reports?
Business intelligence reporting encompasses a diverse set of applications in BI, including everything from traditional reports to interactive dashboards and embedded analytics. When planning your BI strategy, it’s important to take into account the bigger picture and anticipate any future needs. For instance, you may initially only require static reports, but later on, you may need alerts for certain key performance indicators, which would necessitate real-time dashboards. Additionally, dashboards may lead to the requirement for self-serve BI, enabling any user to easily access and explore data to quickly answer their own questions.
Some examples of business intelligence reporting are mentioned below:
- Sales reports: These reports provide data on sales performance, such as revenue, unit sales, and gross margin, by product, region, or other dimensions.
- Financial reports: These reports provide data on financial performance, such as income statements, balance sheets, and cash flow statements.
- Inventory reports: These reports provide data on inventory levels, such as stock-on-hand, stock turnover, and reorder points.
- Customer reports: These reports provide data on customer behavior, such as demographics, purchase history, and lifetime value.
- Production reports: These reports provide data on production performance, such as output, efficiency, and downtime.
- Employee reports: These reports provide data on employee performance, such as headcount, turnover, and productivity.
- Marketing reports: These reports provide data on the effectiveness of marketing campaigns, such as lead generation, conversion rates, and return on investment.
- Supply chain reports: These reports provide data on supply chain performance, such as supplier performance, delivery times, and inventory levels.
Standard reports are typically created with the goal of providing easy and quick access to the relevant data in order to support the decision-making process.
What are the benefits of business intelligence reporting?
Business intelligence reporting can provide a variety of benefits to organizations.
Improved decision making
By providing easy access to accurate, up-to-date data, business intelligence reporting can help managers and other stakeholders make more informed decisions. This can lead to better business performance and improved competitiveness.
Greater efficiency
Business intelligence reporting can automate many routine data-gathering and analysis tasks, allowing employees to focus on more strategic activities. This can lead to increased productivity and cost savings.
Enhanced visibility
Business intelligence reporting can provide organizations with a comprehensive view of their performance across different departments and business units. This can help identify areas of strength and weakness and support targeted improvement efforts.
Transforming industries and enhancing the CX with visual AI
Better customer service
Business intelligence reporting can be used to analyze customer data and behavior, helping organizations identify key trends, preferences, and pain points. This can support the development of more effective customer service and support strategies.
Better forecasting
Business intelligence reporting can provide data that can be used for forecasting, which can help organizations make better decisions on budgeting and resource allocation.
Improved compliance
Business intelligence reporting can help organizations stay compliant with regulations and reporting requirements by providing accurate and timely data.
Strategic planning
Business intelligence reporting can help organizations identify long-term trends and patterns in their data, which can inform strategic planning and decision-making.

How to create a quality business intelligence report?
Creating a quality business intelligence report typically involves several steps, including:
Step 1: Define the report’s purpose and audience
Before beginning to create a report, it’s important to understand its purpose and who will be reading it. This will help to ensure that the report is tailored to the specific needs of its audience and that it addresses the right questions.
Step 2: Gather and clean the data
Collecting and preparing the data that will be used in the report is an important step. This may involve pulling data from various sources, such as databases, spreadsheets, and external systems, and then cleaning and organizing it to ensure that it is accurate and complete.
Step 3: Analyze the data
Once the data has been prepared, it can be analyzed to identify key trends, patterns, and insights. This may involve using various statistical techniques, such as descriptive statistics, correlation analysis, and regression analysis, to understand the data.
Step 4: Create the report
Once the data has been analyzed, it can be used to create the report. This may involve creating charts, tables, and other visualizations to help convey the information clearly and effectively. It’s important to choose the right visualization format that fits the data and message to be conveyed.
Step 4: Review and distribute the report
Before distributing the report, it’s important to review it to ensure that it is accurate and that the information is presented clearly. This can be done internally or with a third-party review. Once the report has been reviewed, it can be distributed to the intended audience, either in print or electronic format.
Step 5: Monitor and update the report
Business intelligence is not a one-time effort, it is a continuous process. Therefore, it’s important to set up a schedule to monitor the report, and make updates as needed.
In addition to these steps, it’s important to consider the design, formatting, and overall layout of the report, as well as the use of clear and concise language. This can help to ensure that the report is easy to understand and that the information is presented in a way that is meaningful to its intended audience.
BIDW: What makes business intelligence and data warehouses inseparable?
BI reporting tools list
Below, you can find some of the top business intelligence reporting tools available in the market; each of them offers unique features and serves specific purposes to help organizations make informed decisions:
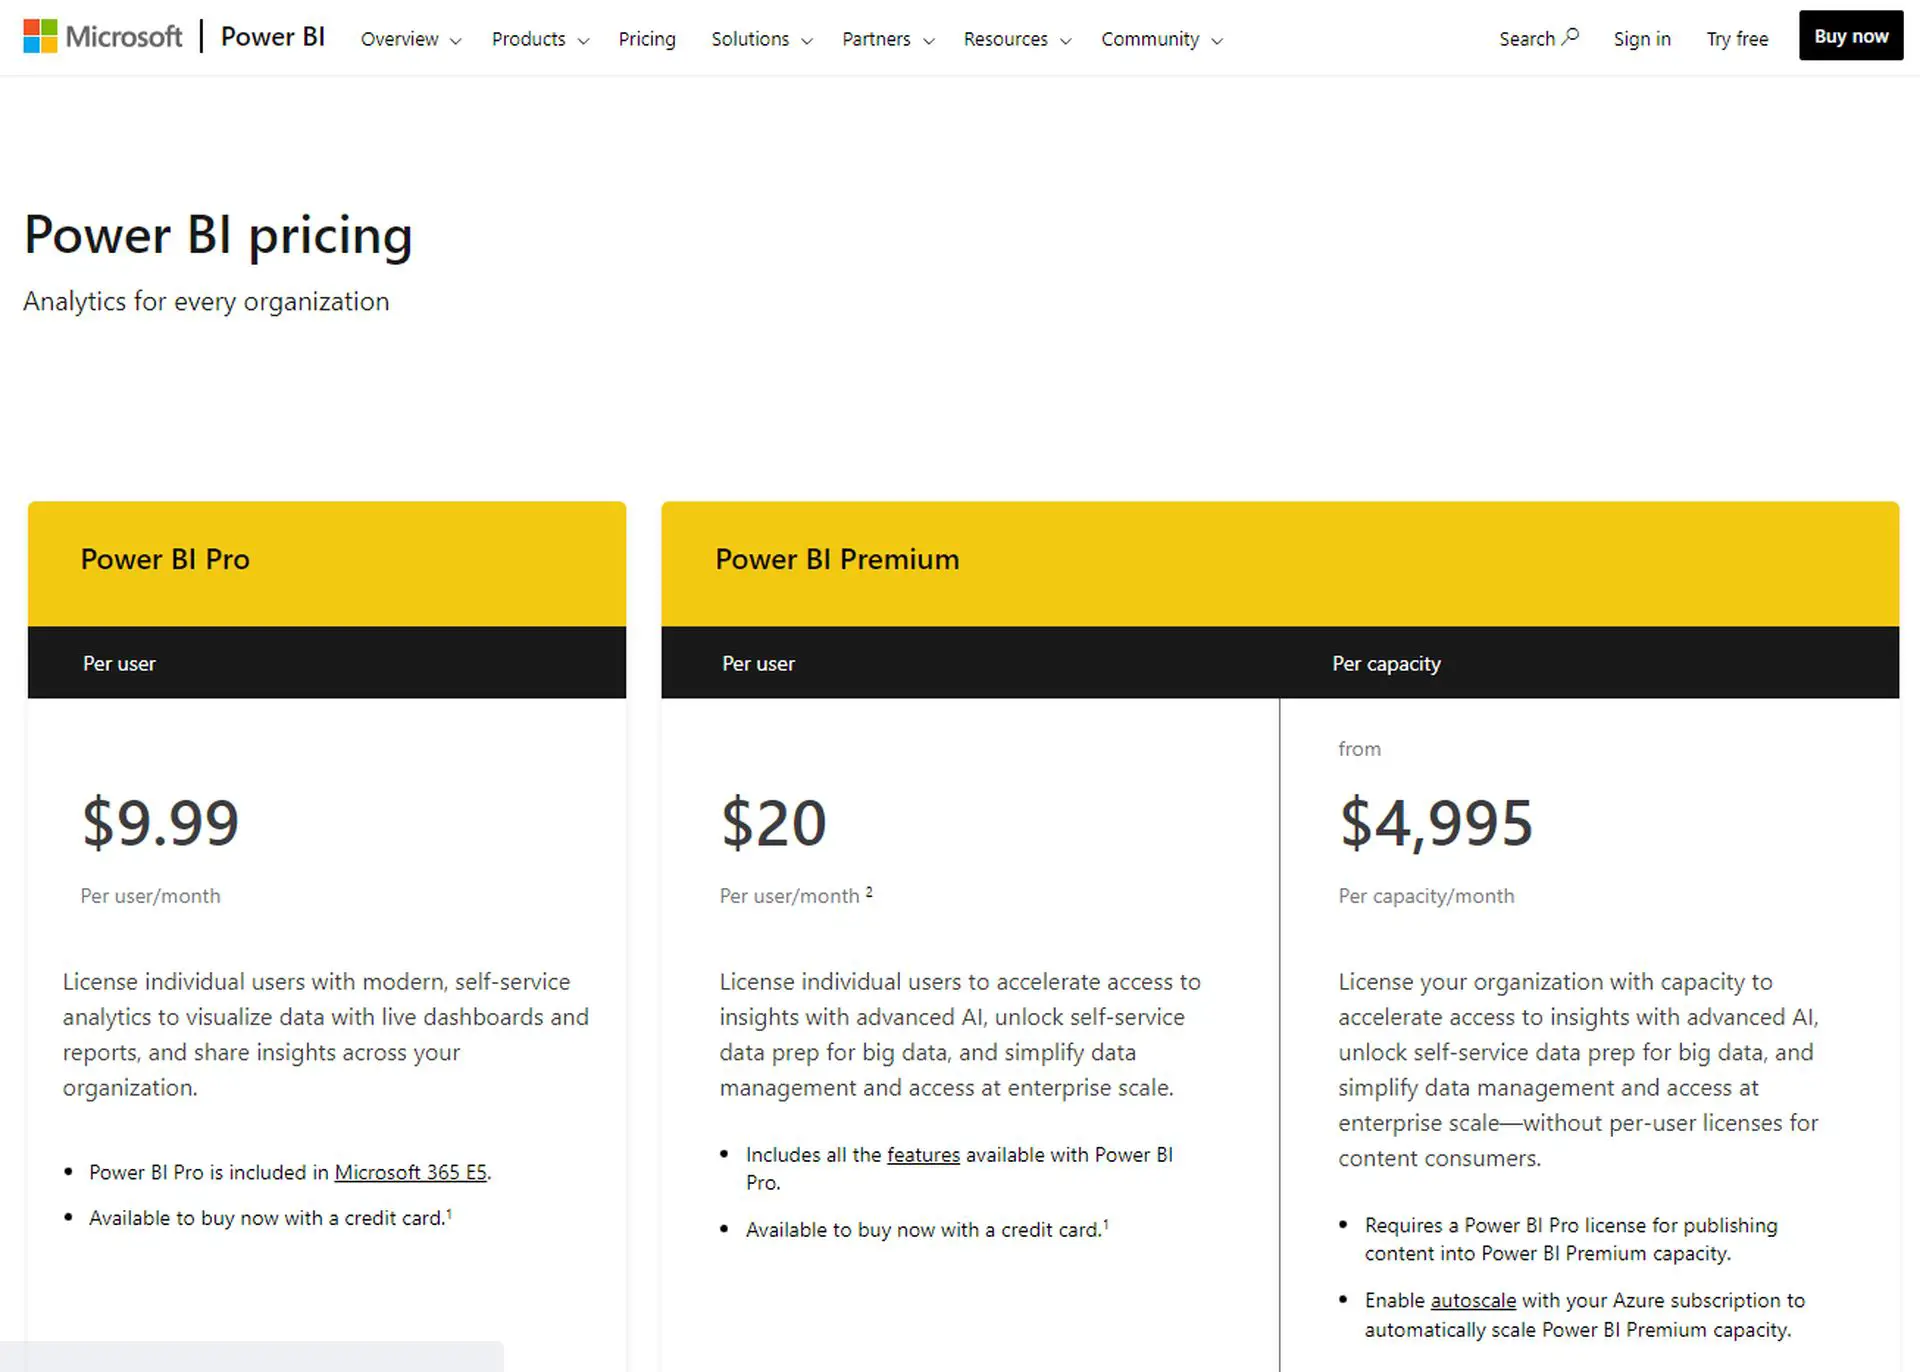
Power BI reporting
Power BI, a product from Microsoft, is a business intelligence tool that allows you to visualize your data and share insights. It can take data from various sources and transform it into interactive dashboards, and BI reports.

The key features of Power BI reporting:
- Advanced analytics and data management: Power BI provides advanced analytics capabilities that help users gain valuable insights and transform data into powerful components that can provide new ideas and solutions to business problems.
- Quick Insights: With the help of powerful algorithms, users can quickly identify insights from various subsets of data. Quick Insights makes it easy for users to access analytics results with just a single click.
- Ask a question: Power BI allows users to ask questions and get instant visual responses in the form of charts, tables, or graphs.
- Relevant reports: Power BI reports are well-organized collections of dashboards that provide relevant visualizations and formats for specific business issues and allow users to share them with others.
- Integration with Azure machine learning: Power BI includes the integration of Azure Machine Learning, which enables users to visualize the outcomes of Machine Learning algorithms by easily dragging, dropping, and joining data modules.
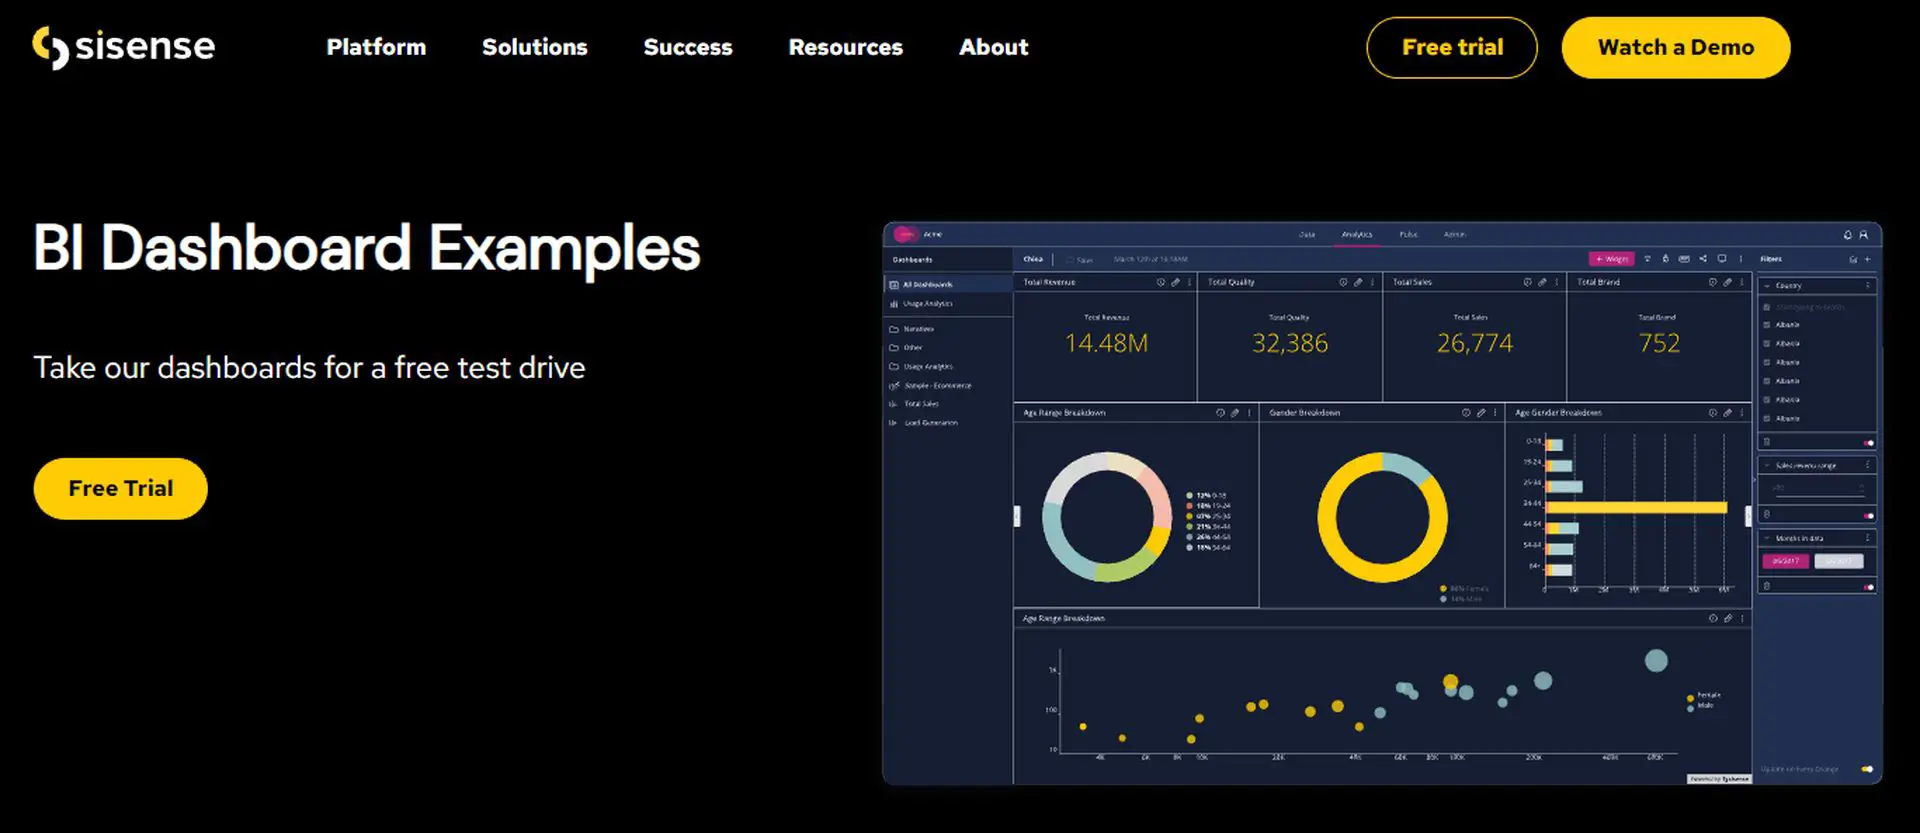
Sisense BI reporting
Sisense is considered one of the leading solutions in the business intelligence market, having won the Best Business Intelligence Software Award from FinancesOnline. It offers an all-inclusive BI reporting tool, which is a self-service analytics and reporting platform that enables anyone to quickly create interactive dashboards and powerful reports. Even those without technical expertise can easily generate robust visual reports without needing to spend extra time on preparation.

The key features of Sisense BI reporting:
- Reports that are fully interactive and self-updating
- Reports and dashboards that are fed by real-time data.
- Effortless building and sharing of dashboards
- Ability to create reports from multiple data sources such as Excel, text/CSV files, any database (SQL Server, Oracle, MySQL), and cloud sources.
- Reports with visually appealing and informative visualizations
- Compatibility with any mobile or desktop device.
Oracle BI reporting
Oracle’s business intelligence solution offers a comprehensive set of features for intelligence, analytics, and reporting. It is designed to handle heavy workloads and complex deployments, making it suitable for organizations of all types. With Oracle BI, users can explore and organize their business data from a wide range of sources, and the system will create visualizations to display the data in a user-friendly format. This allows users to easily gain insights from charts, graphs, and other graphics, which in turn helps them make data-driven decisions for their organization.

The key features of Oracle BI reporting:
- Oracle BI offers a wide range of interactive data visualization tools such as dashboards, charts, graphs, and other tools. Users can filter, drill down, or pivot data directly from the dashboard, and the system provides prompts and suggestions to guide the exploration process and uncover additional insights.
- Oracle Exalytics allows users to analyze large datasets efficiently without the need for technical professionals such as data analysts.
- The system is designed to be self-service, allowing non-technical users to explore, organize, and interpret data through intuitive visualizations that are easy to understand and share with employees at any level of data literacy.
- Oracle BI provides actionable intelligence by analyzing data and identifying trends, which helps users make informed decisions about business practices, quotas, forecasting, and more.
- Users can set up predefined alerts that send real-time updates when triggered or scheduled, which can be sent via preferred channels, including email, internal file storage, and text message based on the severity of the alert.
- The solution is designed for mobile access with a consistent interface, including multitouch and gestural interactions with map graphics and other advanced features.
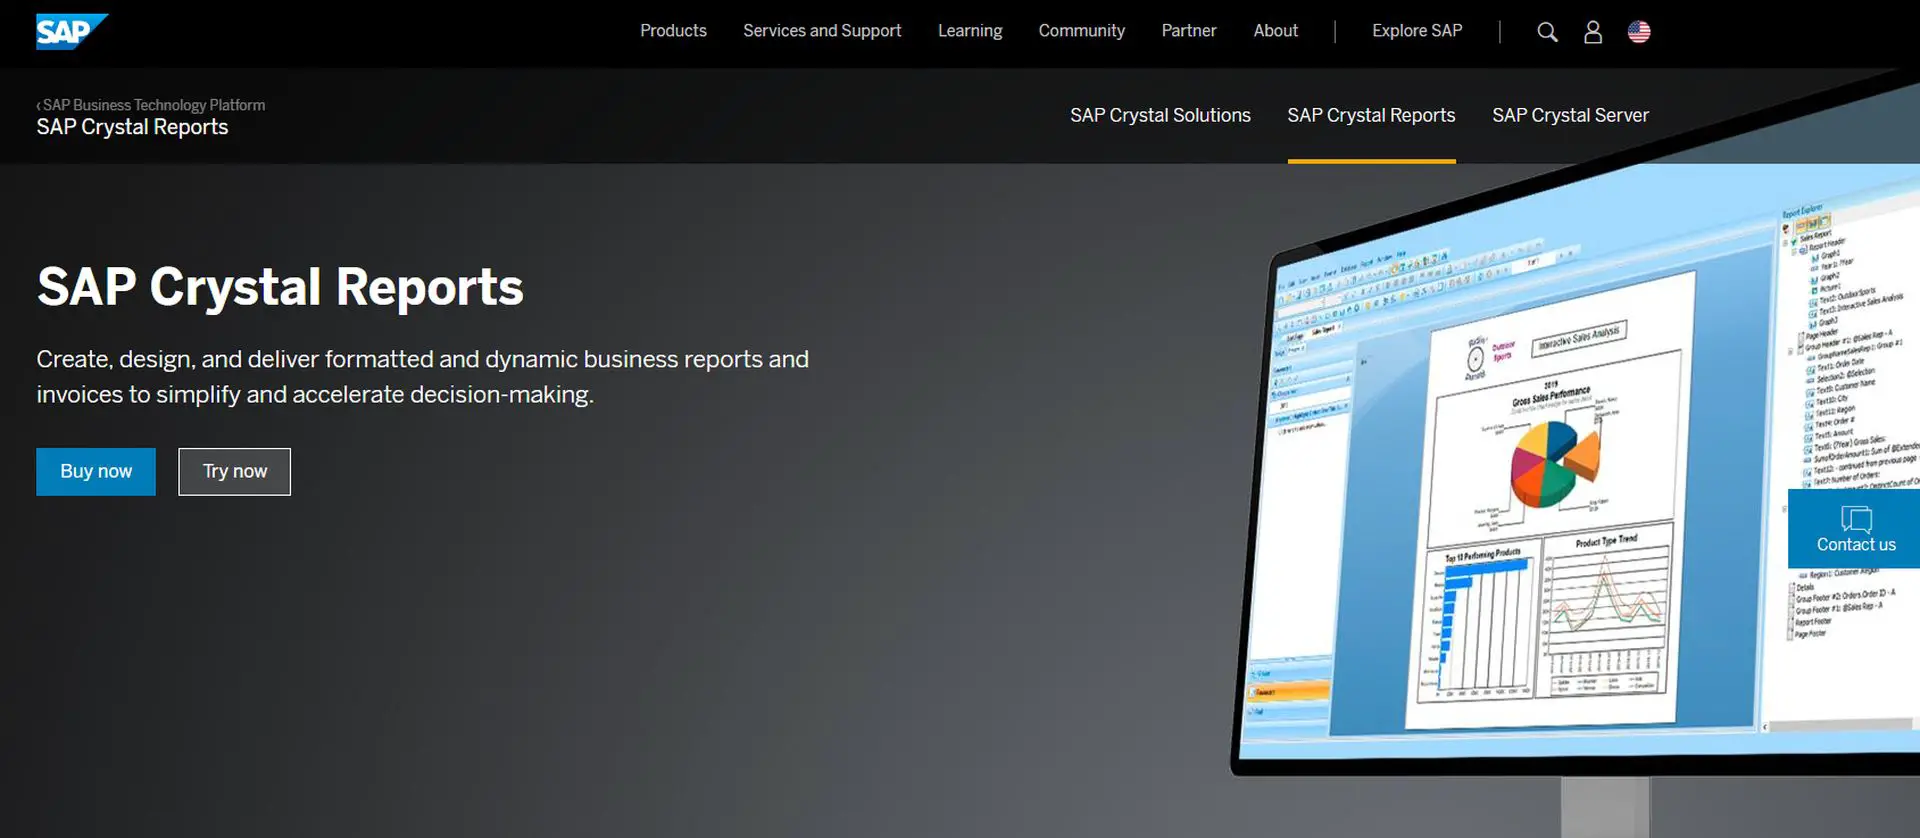
SAP Crystal Reports
SAP Crystal Reports is a widely-used business intelligence reporting software solution that is known for its ability to accelerate decision-making quickly. It is designed to make presenting data through reports simple and easy. The software offers flexibility and customization options for various reports and presentations that can be generated on a daily basis and can be accessed by multiple users. Additionally, it can produce reports based on information from almost any data source.

The key features of SAP Crystal Reports:
- SAP Crystal Reports enables users to create highly formatted reports quickly and easily.
- It enables efficient content delivery throughout large organizations.
- It allows users to create multilingual reports.
- It provides an interactive report exploration feature.
- It offers the ability to access parameter values without the need to refresh data.
- It allows users to create direct connectivity to data sources without data modeling.
Final words
Business intelligence reporting is an essential aspect of any organization’s operations. Access to accurate and timely data is crucial for making strategic decisions that drive growth and success. Business intelligence reporting tools provide organizations with the capability to gather and analyze data from various sources and present it in a meaningful and actionable manner. These tools are invaluable for organizations looking to stay ahead of the curve and make data-driven decisions.
- SEO Powered Content & PR Distribution. Get Amplified Today.
- Platoblockchain. Web3 Metaverse Intelligence. Knowledge Amplified. Access Here.
- Source: https://dataconomy.com/2023/01/business-intelligence-reporting-tools/


