Simon Portegies Zwart, an astrophysicist at Leiden University in the Netherlands, is ecologically conscious. He hardly ever flies for professional reasons anymore, preferring to travel by train instead. “I like to be environmentally friendly by being a vegetarian, trying to reduce my carbon footprint, telling my children not to shower too long, switching to renewable resources.” But once Portegies Zwart had decided to make those changes, he started considering other aspects of his carbon footprint too.
“I’m a heavy user of large machines and these computers consume as much energy as a small city,” he explains. “I think I am probably the most polluting person on my street. If I run a supercomputer that takes as much energy as 10,000 households then who am I to tell my children, or other people, they shouldn’t shower for 20 minutes?”
As the world grapples with the consequences of climate change, many scientists have begun to face up to the realities of their carbon emissions. Much of the focus is on air travel for academic purposes, where researchers are facing uncomfortable revelations. It turns out, for example, that climate-change researchers fly more frequently than scientists in other fields. According to a 2020 study (Glob. Environ. Change 65 102184), climate scientists jet off two to three times a year on average, whereas other researchers get on planes just twice during that time. But other scientists also fly a lot. A 2019 study (Environ. Res. Lett. 14 095001) found that professors at the University of Montreal in Canada had twice the annual carbon footprint of the average Canadian, with most of the difference linked to professional travel.
Trips to academic conferences in particular are a huge part of the problem. When the Fall Meeting of the American Geophysical Union took place in California in 2019 the 28,000 delegates emitted around 80,000 tonnes of CO2 equivalent (tCO2e) travelling there and back home afterward. This was almost three tonnes per scientist, or the average weekly emissions of the city of Edinburgh (Nature 583 356).
Furthermore, another recent Canadian study, done at the University of British Columbia, showed that air travel for academia has little to no positive impact on productivity or professional success (J. Cleaner Prod. 226 959). And of course, in light of the global COVID-19 pandemic, most academics have been forced to adopt and embrace online conferences and workshops. Online events have allowed a more diverse range of delegates to attend, but there have been environmental benefits too. A 2021 study found that 7000 virtual delegates at three large scientific meetings, held online in 2020, had the same carbon footprint as a single in-person attendee to the same events in 2019 (Nat. Sustain. 10.1038/s41893-021-00823-2).
Researchers working in physics have found that their computer usage can make up a huge part of their carbon footprint – sometimes even more than air travel
Cosmic computing costs
While the impact of academic travel on climate change is indisputable, over the last few years a number of physicists have found that their computer usage can make up a huge part of their carbon footprint – sometimes even more than air travel.
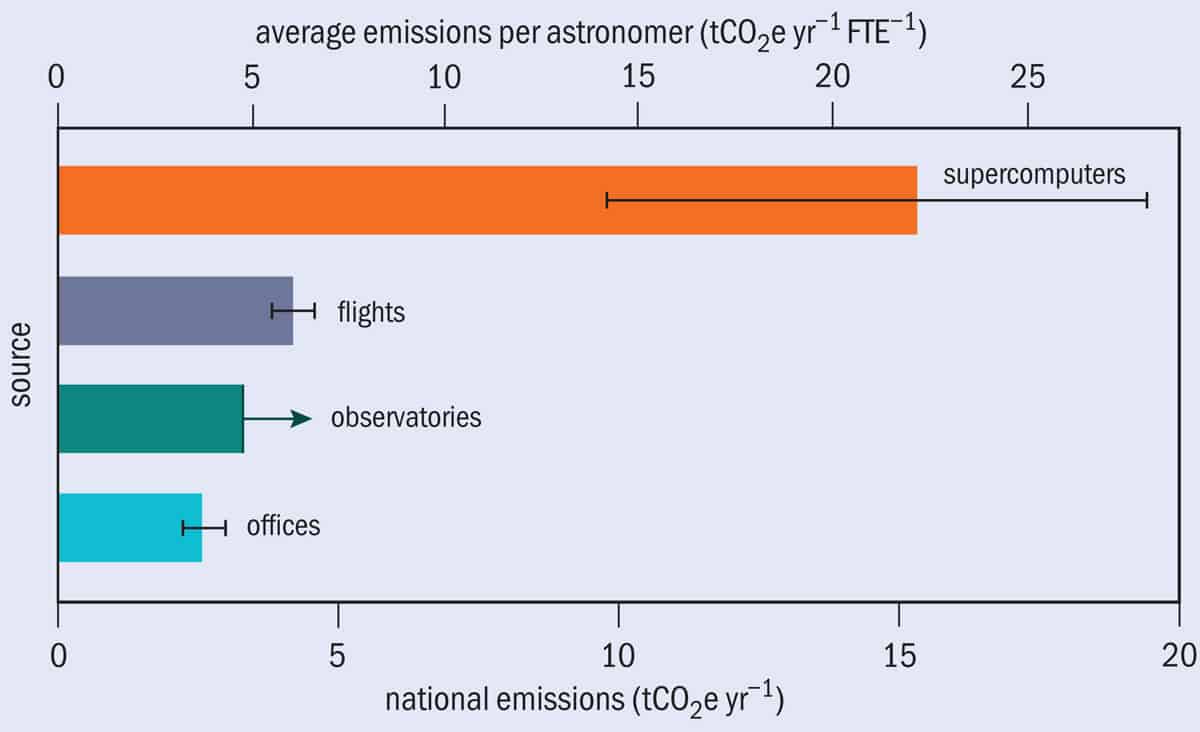
Just ask Adam Stevens, an astrophysicist at the University of Western Australia. Together with colleagues, he has analysed Australian astronomers’ total greenhouse-gas emissions over 2018–2019 from “regular activities” such as travelling, using supercomputers and working at large observatories. The study found that the average Australian astronomer produces around 37 tCO2e per year (Nat. Astron. 4 843). That’s 40% more than the average Australian and five times the global average. The biggest contribution to this was the use of supercomputers to process the enormous amounts of data collected by telescopes and carry out cosmological simulations. At around 15 tonnes per astronomer, it ran to almost four times their annual emissions from flights (figure 1).
In another example, the upcoming Giant Array for Neutrino Detection (GRAND) project will use 200,000 antennas spread across mountainous regions around the world to detect ultrahigh-energy neutrinos originating from deep space. Last year, the team behind the project estimated the greenhouse gas emissions for the three different stages of experiment: the prototype, the mid-scale stage and the full-scale experiment, which will start in the 2030s. What they call “digital technologies” – simulations and data analysis, data transfer and storage, and computers and other electronic devices – will account for a huge proportion of the project’s carbon footprint (Astroparticle Physics 131 102587).
In the prototype stage 69% of emissions are expected to be from digital technologies, compared with 27% from travel and 4% from “hardware equipment”, such as manufacturing the radio antennas. In the mid-stage, digital technologies will account for 40% of emissions, with the rest split equally between travel and hardware. Once the full experiment is up and running most of the emissions will be shared between hardware (48%) and digital technologies (45%).
What’s interesting is that the environmental cost of supercomputing can depend hugely on where the energy to power the devices comes from. In 2020 the Dutch Astronomy Council asked Portegies Zwart and a group of other researchers to analyse the carbon footprint of its six member institutes (Nat. Astron. 5 1195). They estimated that in 2019, the average astronomer in the Netherlands emitted 4.7 tCO2e – far less than in Australia – with just 4% of that coming from supercomputing.
Floris van der Tak, an astrophysicist from the Netherlands Institute for Space Research who led the study, sees no reason why Dutch astronomers would be using supercomputers less than their Australian colleagues. The differences are therefore likely due to differences in energy supply. In particular, the Dutch national supercomputing facility SURF does not produce any carbon emissions because it uses 100% renewable power produced by wind or solar in the Netherlands. The few emissions that are released come from using international facilities and smaller Dutch supercomputers. In fact, Portegies Zwart now always checks to see whether a supercomputer he uses runs on green energy and, if it not, he considers using a different facility. Similarly, van der Tak’s advice is “before you ask for time on a facility, first check what kind of power they are using”.
Source of the problem
Greenhouse-gas emissions at the Max Planck Institute for Astronomy in Heidelberg, Germany, highlight similar intercountry differences. In 2018 each researcher at the institute emitted around 18 tCO2e (Nat. Astron. 4 812) – more than astronomers in the Netherlands, but half that of their Australian counterparts (figure 2). These emissions were also 60% higher than the average German resident and three times the German target for 2030, which is in line with the Paris Climate Accords.
Around 29% of the Max Planck Institute’s emissions in 2018 were from electricity consumption, with computing, particularly supercomputing, accounting for 75–90% of that. The key difference between Germany and Australia was where the power came from. In 2018 around half of Germany’s electricity was from solar and wind, whereas in Australia the vast majority was produced from fossil fuels, mainly coal. This meant that in Australia, electricity for computing produced 0.905 kg of CO2 per kilowatt hour, while the Max Planck Institute emitted 0.23 kg of CO2 per kilowatt hour.

Van der Tak does point out that much of this work was conducted a few years ago, and that the world has moved on. More offices now use renewable power, for example. As the Dutch study found, just under a third (29%) of Dutch astronomy’s carbon footprint in 2019 came from its use of electricity, including powering local computing at the six research institutes. Back then, half of the institutes were running on green electricity. But since then, two more have moved to 100% renewable power and van der Tak expects the sixth to make the switch in the next two years.
Indeed, things have also changed in Australia. Since July 2020 one of the country’s three national high-performance computing facilities, the OzSTAR supercomputer, has switched to 100% renewable energy purchased from a nearby wind farm. Swinburne University of Technology, which hosts the supercomputer, claims this will dramatically cut its carbon footprint, as electricity represented more than 70% of emissions.
Location, location, location
But how can you work out the emissions from the supercomputer you happen to be using? When mathematician and physicist Loïc Lannelongue found there was no easy answer, he developed Green Algorithms. It’s an online tool that enables researchers to estimate the carbon footprint of their computing.
Lannelongue, who is based at the University of Cambridge, UK, reiterates that location is key. Running the same task on the same hardware in Australia, for example, would emit around 70 times more carbon than in Switzerland, which gets much of its electricity from hydropower. The research behind the algorithm (Adv. Sci. 8 2100707) shows that a more efficient computing centre can quickly lose its green advantage if it uses less renewable energy than an alternative less efficient supercomputer. While estimating the carbon footprint of any algorithm is based on key factors such as hardware, how long the task takes and the location of the data centre or supercomputer, Green Algorithms also has a “pragmatic scaling factor” (PSF) that estimates the number of times a computation is performed in practice – which has a direct impact on emissions.
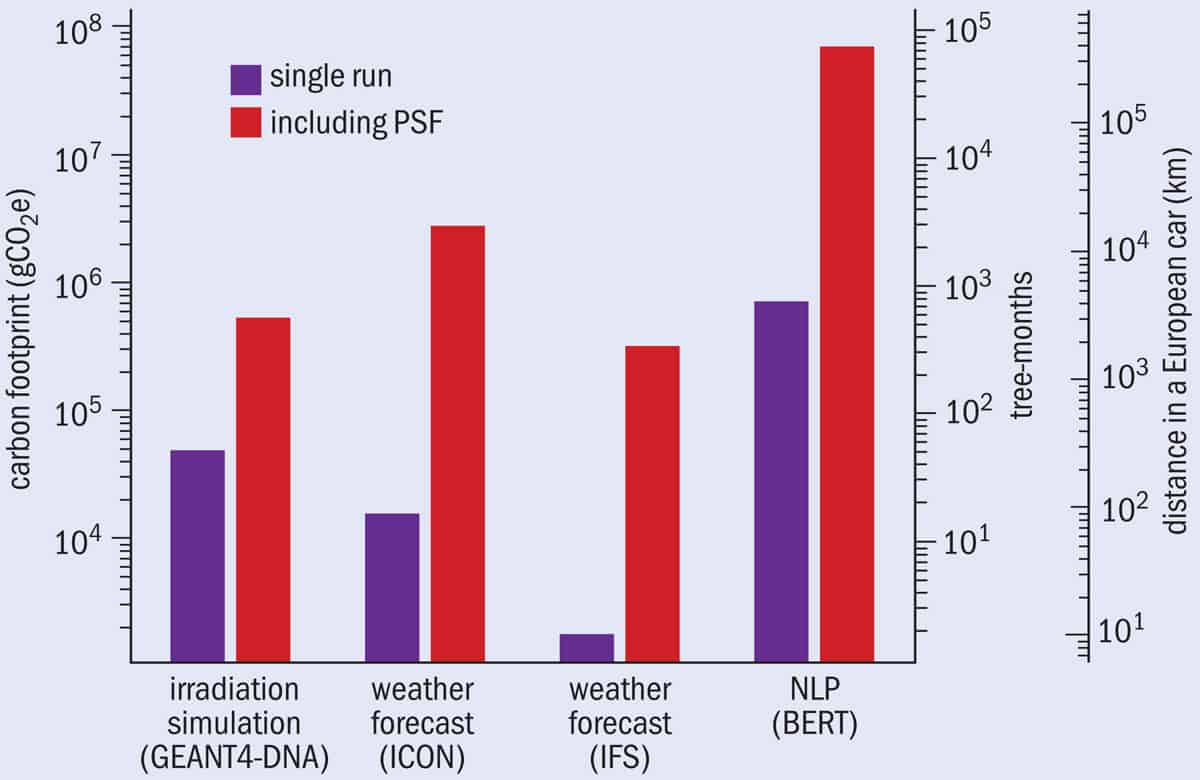
Indeed, most algorithms are run multiple times – sometimes even many hundreds of times with different parameters – and the number can vary greatly depending on the task and the research field (figure 3). The research also found that the emissions of computing in South Africa, as well as some states in the US, are similar to Australia. On the other hand, the carbon intensity of electricity in Iceland, Norway and Sweden is particularly low.
With cloud computing it is now much easier for researchers to choose which supercomputer they use. But if they are unable to switch to a different machine, there are still other ways they can reduce their emissions. Lannelongue says that simply using the latest version of your software can make a massive difference. “Updating versions and using optimized software is maybe the next big step if you can’t act on location because it will impact everything, as it will reduce the computing requirements,” he explains.
Better coding
Efficient coding is also vital for making computing greener. “I see a lot of people around me coding extremely inefficiently,” says Portegies Zwart. But as he explains, if you take a bit more time and optimize your code, it will run faster, and so produce fewer emissions. Switching coding languages could also be a good idea.
To test this, Portegies Zwart conducted an experiment where he took an algorithm and ran it using about a dozen different coding languages (Nat. Astron. 4 819). He says that none of the codes were particularly optimized, and each took a similar amount of time to write. But Python, the most popular coding language among physicists, takes a lot longer to run and so produces more emissions than other languages, such as C++ or Fortran. The issue, according to Portegies Zwart, is that Python is extremely easy to use, but hard to optimize, while other languages are harder to code, but easier to optimize.
Simply shifting away from Python, however, is not necessarily the answer. In response to Portegies Zwart’s paper, CNRS researcher Pierre Augier argued that better education and the use of Python compilers could be just as effective. Augier, an expert in fluid dynamics and turbulence at the University of Grenoble Alpes in France, used better optimized code and five different implementations of Python to run a similar experiment. He found that four of the implementations were faster and produced fewer emissions than C++ and Fortran, adding that they are also simpler to understand and use (Nat. Astron. 5 334).
“I don’t think it is easier to move to a different language, because it is not very difficult to learn how to correctly use Python,” Augier explains. Instead of focusing on what coding language to use, he argues that computing and programming should be a bigger part of physics education. “We should learn it when we are students, as soon as we specialize in physics.” Portegies Zwart agrees that Python can be efficient, but he says that does not reflect reality. “I’m not bashing Python, I’m using Python the way most astronomers do, and that is not very highly optimized,” he explains. He thinks that instead of teaching physicists more computing, perhaps physics research institutes should employ more computer experts. “We are great at physics, but a computer scientist spent all the time we learned about physics learning how to communicate with a computer,” he says. “There is no doubt that [they] will be better at programming.”
Hidden emissions
But it is not just simulations on supercomputers that can be carbon intensive. Kumiko Kotera, from Sorbonne University in France, who co-founded the GRAND neutrino project, says that when you look at the experiment’s predicted emissions “you can see that what is really costly is data storage and data transfer”. Kotera and her colleagues found that data storage and transfer will account for roughly half of total annual emissions in the prototype stage of the experiment, a quarter in the mid-stage and more than a third during the full-scale experiment (Astroparticle Phys. 131 102587). By comparison, data analysis and simulations will produce around 16%, 13% and 7% of emissions, during the three stages, respectively.
The carbon footprint of data storage and transfer comes from the energy demands of data centres. As with supercomputers, data storage can be tackled to an extent by using data centres with lower emissions. Kotera says that the GRAND project will also be looking at strategies to reduce the volume of data. She explains that this will probably involve being mindful about what is archived – “we don’t need to keep everything” – and finding ways to efficiently clean data.
“If we can clean up the data quite quickly, we can probably reduce a lot of the volume and emissions,” she explains. “For data transfer it is tricky because it is a global network.” But cleaning and reducing data volumes can still help, and scientists can also be careful about what they transfer. Multiple people repeatedly transferring the same pieces of data around the world can quickly add up.
The team calculated that data transfer during GRAND’s five-year prototype stage will emit 470 tCO2e – similar to around 270 flights from Paris to Dunhuang airport, near the prototype’s experimental site in China. In fact, the researchers found that sending hard drives by plane four times a year would be many orders of magnitude less carbon-emitting than transferring the data online.
Due to the distributed, global nature of data centres, calculating emissions from data storage and transfer can be tricky. Kotera cautions that their figures are not precise as there are many unknowns, while van der Tak is unsure how much data storage and transfer is covered by the carbon footprint analysis of Dutch astronomy, adding that it might be something they need to look at.
Particle physicists need to do their bit too. CERN, for example, produces around 100 petabytes of data every year. This is stored, distributed and analysed using the Worldwide LHC Computing Grid (WLCG), a global collaboration of around 170 computing centres in more than 40 countries. CERN now publishes environment reports, with the second – published last year – describing the energy-efficiency improvements implemented at the LHC, specifically its ability to gather more data per unit of energy used. Over the 20-year lifespan of the upgraded machine, it will be 10 times more energy efficient than when CERN’s flagship facility was originally switched on. But the report also acknowledges that it doesn’t really cover the emissions of the WLCG. Energy consumption is only detailed for WLCG facilities owned or operated by CERN.
Change your mindset
Lannelongue would like it if researchers just started thinking more about the emissions of their computing, factoring it into their decisions. A good example is running inefficient code and software overnight because you have the computer resources and you are going to be at home in bed, so it does not matter if it takes ages. “That is fine until you say if I make it more efficient, I will save greenhouse-gas emissions and I will reduce my carbon footprint – so suddenly there is an incentive to do so,” he explains.
When it comes to the GRAND project, Kotera says the plan is for the experiment to have simulation libraries that allow people to reuse commonly run simulations instead of producing their own, thereby preventing the same data from being reproduced again and again. According to Kotera this is common practice, even on large collaborations: different people repeatedly running identical simulations, because there is no central store. “It is so easy nowadays to just push a button and run a one-week simulation, get the result and then say ‘oh, I didn’t really need it’,” she says. “Our goal is to really encourage people to think ahead of running simulations whether this is something that they really need.”
The post The huge carbon footprint of large-scale computing appeared first on Physics World.

