Published 2 hours ago
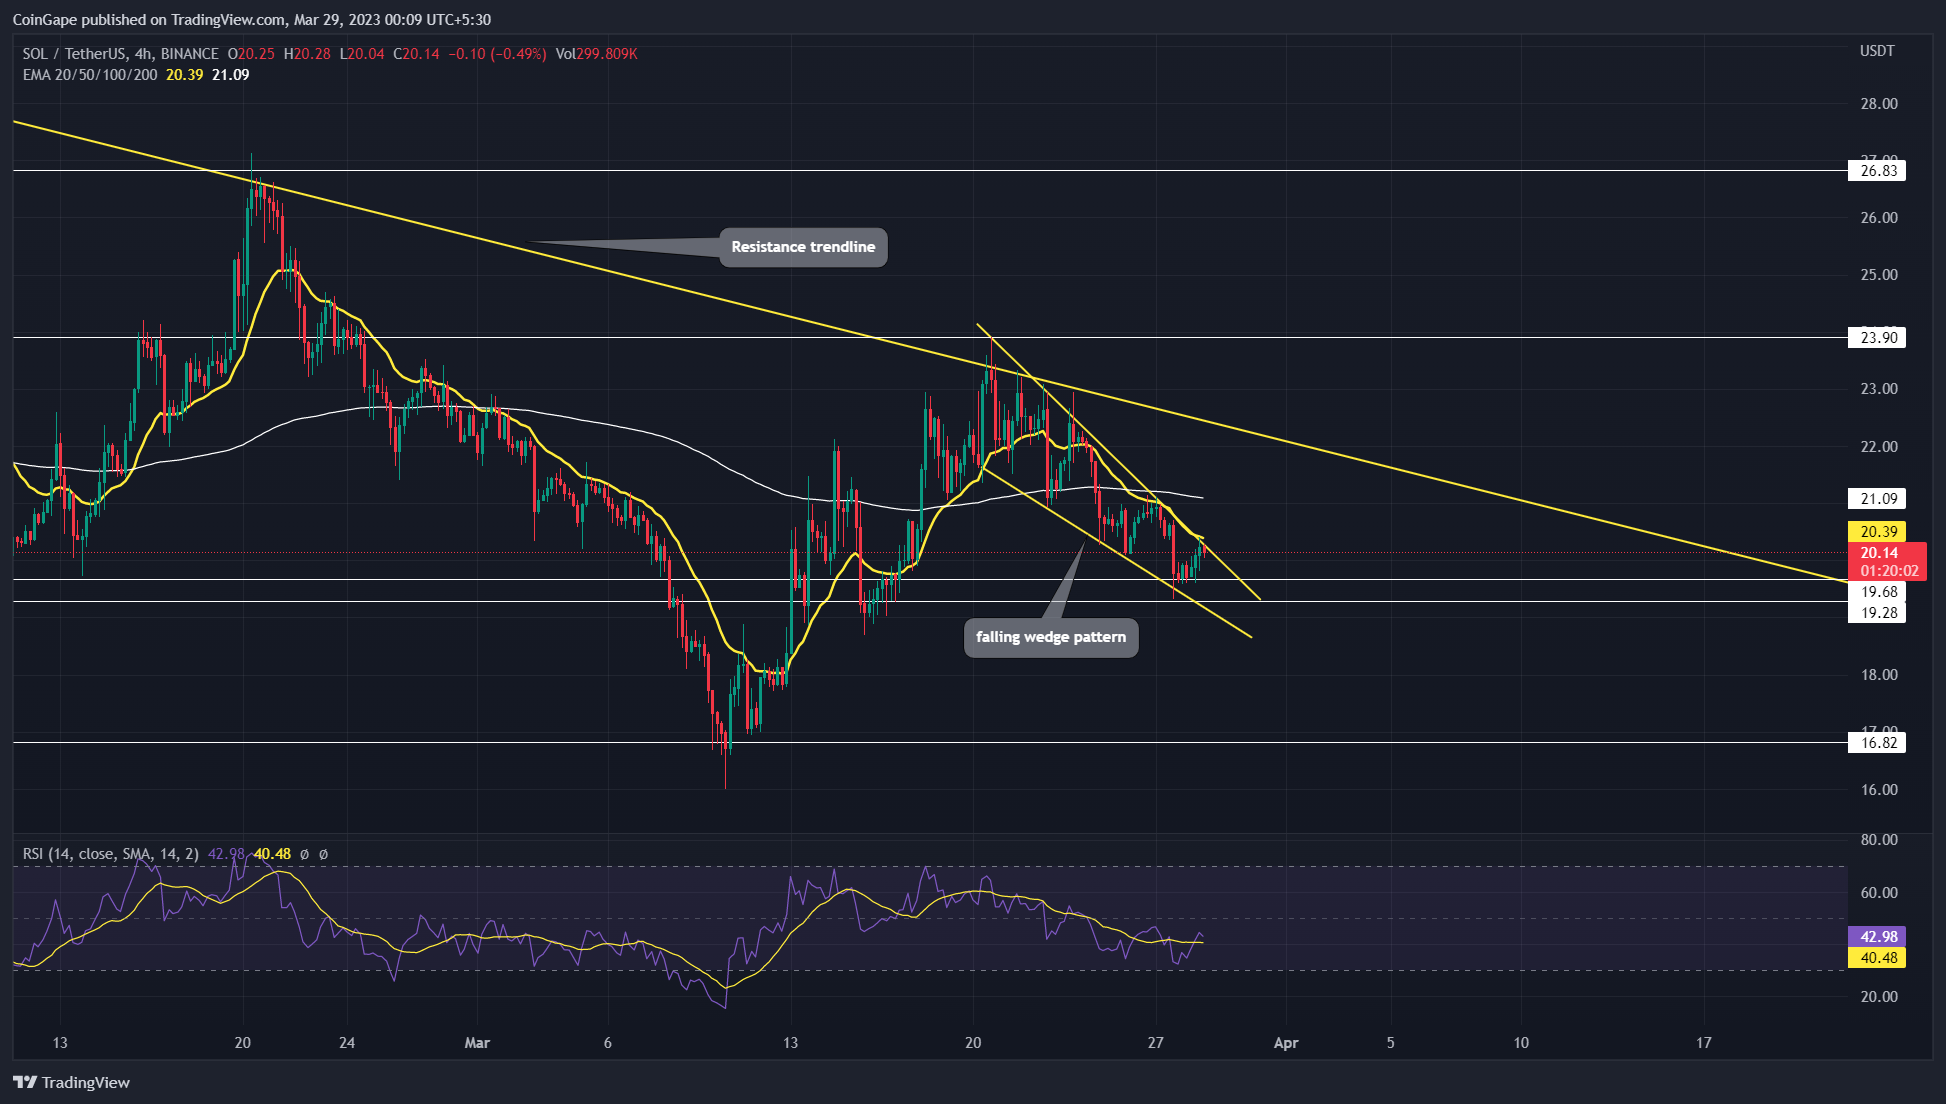
SOL Price Prediction: Amid the increasing bearishness in the crypto market the Solana coin price has witnessed a correction phase for over a week now. From the peak of $23.9, the coin price has tumbled 15.4% to reach the current price of $1.61. However, the downfall was shaped into a famous bullish continuation pattern called a falling wedge. This pattern offers a bullish technical setup that could assist buyers to undermine the prior correction phase.
Key Points
- A bullish breakout from the wedge pattern’s resistance trendline will drive the SOL price 8-10% higher.
- A descending trendline governs the ongoing downtrend in the Solana coin
- The 24-hour trading volume in the Solana coin is $298.5 Million, indicating a 13% loss.
Source-Tradingview
In the 4-hour time frame chart the Solana price shows the formation of a falling wedge pattern. In theory, the coin price resonating between the pattern’s converging trendline indicates a gradual loss of bearish momentum.
Trending Stories
Once the prices reach the peak of the wedge pattern, the buyers are likely to breach the overhead trendline which will signal the end of ongoing correction. A 4-hour candle closing above the trendline will offer buyers suitable support to lead a price rally 8-10% higher and challenge the long-coming resistance trendline.
Also Read: Top Crypto Copy Trading Platforms For 2023
Over the past ten months, a descending trendline has maintained a steady downtrend and restricted buyers from carrying a sustained recovery. Thus, a potential retest to the overhead trendline will trigger a battle between buyers and sellers to regain trend control.
If the sellers continue to defend the downsloping trendline, the coin holders may witness a prolonged correction.
On a contrary note, a breakout above the signal for trend reversal.
Technical Indicator
RSI: contrary to the sideways trendline, the RSI slope in the 4-hour chart rising indicates rising buying pressure at lower levels. This bullish divergence gives additional confirmation for the overhead trendline breakout
EMAs: the 20 EMA aligned with the aforementioned pattern resistance trendline gives an extra edge to short sellers.
Solana Coin Price Intraday Level
- Spot price: $20.13
- Trend: Bullish
- Volatility: Medium
- Resistance levels: $22.5 and $27
- Support levels: $20 and $16
Share this article on:
advertisement
The presented content may include the personal opinion of the author and is subject to market condition. Do your market research before investing in cryptocurrencies. The author or the publication does not hold any responsibility for your personal financial loss.
<!– Close Story–>
- SEO Powered Content & PR Distribution. Get Amplified Today.
- Platoblockchain. Web3 Metaverse Intelligence. Knowledge Amplified. Access Here.
- Source: https://coingape.com/markets/sol-price-prediction-bullish-pattern-sets-solana-price-for-10-upswing-but-theres-a-catch/

