Predict Customer Churn (the right way) using PyCaret
A step-by-step guide on how to predict customer churn the right way using PyCaret that actually optimizes the business objective and improves ROI.
By Moez Ali, Founder & Author of PyCaret
Predict Customer Churn (the right way) using PyCaret — Image by Author
Introduction
Customer retention is one of the primary KPI for companies with a subscription-based business model. Competition is tough particularly in the SaaS market where customers are free to choose from plenty of providers. One bad experience and customer may just move to the competitor resulting in customer churn.
What is Customer Churn?
Customer churn is the percentage of customers that stopped using your company’s product or service during a certain time frame. One of the ways to calculate a churn rate is to divide the number of customers lost during a given time interval by the number of active customers at the beginning of the period. For example, if you got 1000 customers and lost 50 last month, then your monthly churn rate is 5 percent.
Predicting customer churn is a challenging but extremely important business problem especially in industries where the cost of customer acquisition (CAC) is high such as technology, telecom, finance, etc. The ability to predict that a particular customer is at a high risk of churning, while there is still time to do something about it, represents a huge additional potential revenue source for companies.
How is the Customer Churn machine learning model used in practice?
The primary objective of the customer churn predictive model is to retain customers at the highest risk of churn by proactively engaging with them. For example: Offer a gift voucher or any promotional pricing and lock them in for an additional year or two to extend their lifetime value to the company.
There are two broad concepts to understand here:
- We want a customer churn predictive model to predict the churn in advance (let’s say one month in advance, three months in advance, or even six months in advance — it all depends on the use-case). This means that you have to be extremely careful of the cut-off date i.e. You shouldn’t be using any information after the cut-off date as a feature in the machine learning model, otherwise it will be leakage. The period before the cut-off date is known as the Event.
- Normally for customer churn prediction, you will have to work a little bit to create a target column, it’s generally not available in the form you would want it. For example, you want to predict if the customer will churn within the next quarter, and so you will iterate through all the active customers as of your event cut-off date and check if they left the company in the next quarter or not (1 for yes, 0 for no). The quarter in this case is called Performance Window.
How to create customer churn dataset — Image by Author
Customer Churn Model Workflow
Now that you understand how the data is sourced and churn target is created (which is one of the most challenging parts of the problem), let’s discuss how this machine learning model will be used in the business. Read the below diagram from left-to-right:
- A model is trained on customer churn history (event period for X features and performance window for target variable).
- Every month active customer base is passed onto Machine Learning Predictive Model to return the probability of churn for each customer (in business lingo, this is sometimes called a score of churn).
- The list will be sorted from highest to lowest probability value (or score as they say it) and the customer retention teams will start engaging with the customer to stop the churn, normally by offering some kind of promotion or gift card to lock in few more years.
- Customers that have a very low probability of churn (or essentially model predicts no-churn) are happy customers. No actions are taken on them.
Customer Churn Model Workflow— Image by Author
Let’s get started with the practical example
In this section, I will demonstrate the complete end-to-end workflow for machine learning model training & selection, hyperparameter tuning, analysis, and interpretation of the results. I will also discuss the metrics that you can optimize and why conventional metrics like AUC, Accuracy, Recall may not be suitable for the customer churn models. I will be using PyCaret — an open-source, low-code machine learning library to perform this experiment. This tutorial assumes you have basic knowledge of PyCaret.
PyCaret
PyCaret is an open-source, low-code machine learning library and end-to-end model management tool built-in Python for automating machine learning workflows. PyCaret is known for its ease of use, simplicity, and ability to quickly and efficiently build and deploy end-to-end machine learning pipelines. To learn more about PyCaret, check out their GitHub.
Features of PyCaret — Image by Author
Install PyCaret
# install pycaret
pip install pycaret
👉Dataset
For this tutorial, I am using a Telecom Customer Churn dataset from Kaggle. The dataset already contains the target column that we can use as is. You can read this dataset directly from this GitHub link. (Shoutout to srees1988)
# import libraries
import pandas as pd
import numpy as np# read csv data
data = pd.read_csv('https://raw.githubusercontent.com/srees1988/predict-churn-py/main/customer_churn_data.csv')
Sample dataset — Image by Author
👉 Exploratory Data Analysis
# check data types
data.dtypes
Data types — Image by Author
Notice that TotalCharges is of an object type instead of float64. Upon investigation, I figured out there are some blank spaces in this column which has caused Python to force the data type as object . To fix that, we will have to trim blank spaces before changing the data type.
# replace blanks with np.nan
data['TotalCharges'] = data['TotalCharges'].replace(' ', np.nan)# convert to float64
data['TotalCharges'] = data['TotalCharges'].astype('float64')
Intuitively contract type, tenure (length of stay of the customer), and pricing plans are very important information when it comes to customer churn or retention. Let’s explore the relationship:
https://gist.github.com/moezali1/2624c9a5eaf78d9a7ffa1b97195a4812
Customer Churn by Tenure, Charges, and Contract Type (Image by Author)
Notice that most churn can be seen in the contracts that are “Month-to-Month”. Makes sense, ofcourse. Also, I can see that as the tenure increases and so are the total charges, the likelihood of customers with high tenure and low charges is less compared to customers with high tenure and high charges.
Missing Values
# check missing values
data.isnull().sum()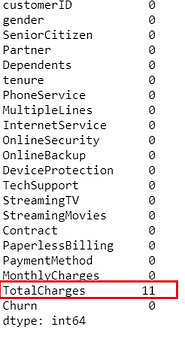
Missing Values — Image by Author
Notice that because we replaced blank values with np.nan there are now 11 rows with missing values in TotalCharges. No problem — I will leave it with PyCaret to impute it automatically.
👉Data Preparation
Common to all modules in PyCaret, the setup is the first and the only mandatory step in any machine learning experiment performed in PyCaret. This function takes care of all the data preparation required prior to training models. Besides performing some basic default processing tasks, PyCaret also offers a wide array of pre-processing features. To learn more about all the preprocessing functionalities in PyCaret, you can see this link.
# init setup
from pycaret.classification import *
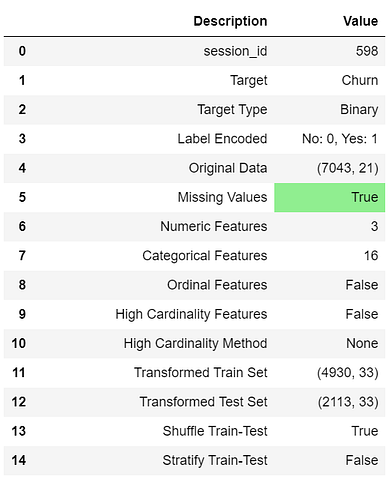
s = setup(data, target = 'Churn', ignore_features = ['customerID'])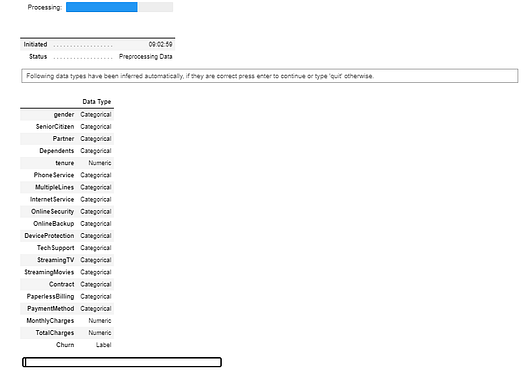
setup function in pycaret.classification — Image by Author
Whenever you initialize the setup function in PyCaret, it profiles the dataset and infers the data types for all input features. In this case, you can see except for tenure MonthlyCharges and TotalCharges , everything else is categorical, which is correct, you can now press enter to continue. If data types are not inferred correctly (which can happen sometimes), you can use numeric_feature and categorical_feature to overwrite the data types.
Also, notice that I have passed ignore_features = ['customerID'] in the setup function so that it is not considered when training the models. The good thing about this is PyCaret will not remove the column from the dataset, it will just ignore it behind the scene for model training. As such when you generate predictions at the end, you don’t need to worry about joining IDs back by yourself.
Output from setup — truncated for display — Image by Author
👉 Model Training & Selection
Now that data preparation is done, let’s start the training process by using compare_models functionality. This function trains all the algorithms available in the model library and evaluates multiple performance metrics using cross-validation.
# compare all models
best_model = compare_models(sort='AUC')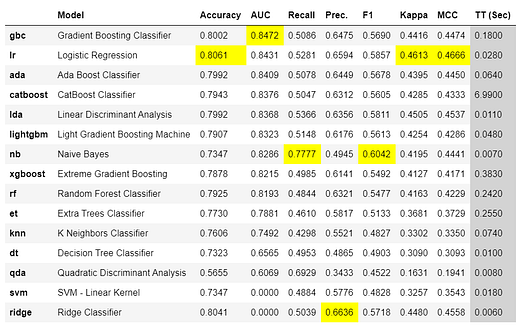
Output from compare_models — Image by Author
The best model based on AUC is Gradient Boosting Classifier . AUC using 10-fold cross-validation is 0.8472.
# print best_model parameters
print(best_model)
Best Model Parameters — Image by Author
Hyperparameter Tuning
You can use the tune_model function from PyCaret to automatically tune the hyperparameters of the model.
# tune best model
tuned_best_model = tune_model(best_model)
tune_model results — Image by Author
Notice that AUC has slightly increased from 0.8472 to 0.8478 .
Model Analysis
# AUC Plot
plot_model(tuned_best_model, plot = 'auc')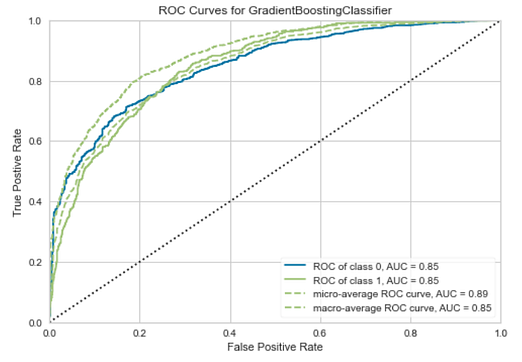
AUC Plot —Image by Author
# Feature Importance Plot
plot_model(tuned_gbc, plot = 'feature')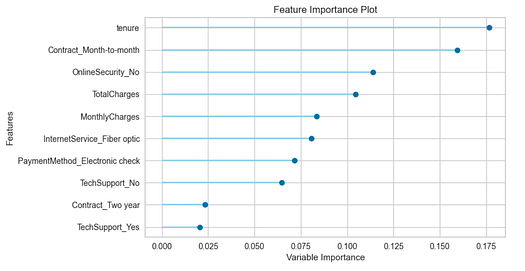
Feature Importance Plot — Image by Author
# Confusion Matrix
plot_model(tuned_best_model, plot = 'confusion_matrix')
Confusion Matrix Gradient Boosting Classifier — Image by Author
This confusion matrix is on the test set which includes 30% of our data (2,113 rows) We have 309 True Positives (15%) — these are the customers for which we will be able to extend the lifetime value. If we wouldn’t have predicted, then there was no opportunity for intervention.
We also have 138 (7%) False Positives where we will lose money because the promotion offered to these customers will just be an extra cost.
1,388 (66%) are True Negatives (good customers) and 278 (13%) are False Negative (this is a missed opportunity).
So far we have trained multiple models to select the best model giving the highest AUC, followed by tuning the hyperparameters of the best model to squeeze a little more performance in terms of AUC. However, the best AUC doesn’t necessarily translate into the best model for business.
In a churn model, often the reward of true positives is way different than the cost of false positives. Let’s use the following assumptions:
- $1,000 voucher will be offered to all the customers identified as churn (True Positive + False Positive);
- If we are able to stop the churn, we will gain $5,000 in customer lifetime value.
Using these assumptions and the confusion matrix above, we can calculate the $ impact of this model:
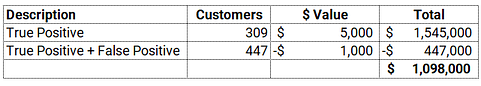
$ Impact of Model over 2,113 Customers — Image by Author
It’s a good model but the problem is it’s not a business-smart model. It is doing a pretty good job compared to if you have no model but how can we train and select a model that maximizes the business value. In order to achieve that we have to train, select, and optimize models using business metrics instead of any conventional metric like AUC or Accuracy.
👉 Adding Custom Metric in PyCaret
Thanks to PyCaret, it is extremely easy to achieve this using add_metric function.
# create a custom function
def calculate_profit(y, y_pred): tp = np.where((y_pred==1) & (y==1), (5000-1000), 0) fp = np.where((y_pred==1) & (y==0), -1000, 0) return np.sum([tp,fp])# add metric to PyCaret
add_metric('profit', 'Profit', calculate_profit)
Now let’s run compare_models and see the magic.
# compare all models
best_model = compare_models(sort='Profit')
Output from compare_models — Image by Author
Notice that a new column Profit is added this time and surprisingly Naive Bayes which is a pretty bad model in terms of AUC is the best model when it comes to profit. Let’s see how:
# confusion matrix
plot_model(best_model, plot = 'confusion_matrix')
Confusion Matrix Naive Bayes — Image by Author
The total number of customers is still the same (2,113 customers in the test set), what’s changed is now how the model is making errors over false positives and false negatives. Let’s put some $ value against it, using the same assumptions (as above):
$ Impact of Model over 2,113 Customers — Image by Author
BAM! We have just increased profit by ~$400,000 with a model that does 2% less in AUC than the best model. How does this happen? Well, for starters, AUC or any other out-of-the-box classification metric (Accuracy, Recall, Precision, F1, Kappa, etc.) is not a business-smart metric, so it does not take into account the risk and reward proposition. Adding a custom metric and using it for model selection or optimization is a great idea and right way to go with.
I hope you will appreciate the simplicity and ease of use in PyCaret. With only a few lines of code, we were able to train multiple models and select the one that matters to the business. I am a regular blogger and I mostly write about PyCaret and its use-cases in the real world, If you would like to be notified automatically, you can follow me on Medium, LinkedIn, and Twitter.
![]()
PyCaret — Image by Author

PyCaret — Image by Author
There is no limit to what you can achieve using this lightweight workflow automation library in Python. If you find this useful, please do not forget to give us ⭐️ on our GitHub repository.
To hear more about PyCaret follow us on LinkedIn and Youtube.
Join us on our slack channel. Invite link here.
Important Links
Documentation
Blog
GitHub
StackOverflow
Install PyCaret
Notebook Tutorials
Contribute in PyCaret
More PyCaret related tutorials:
Machine Learning in Alteryx with PyCaret
A step-by-step tutorial on training and deploying machine learning models in Alteryx Designer using PyCaret
Machine Learning in KNIME with PyCaret
A step-by-step guide on training and deploying end-to-end machine learning pipelines in KNIME using PyCare
Easy MLOps with PyCaret + MLflow
A beginner-friendly, step-by-step tutorial on integrating MLOps in your Machine Learning experiments using PyCaret
Write and train your own custom machine learning models using PyCaret
Build with PyCaret, Deploy with FastAPI
A step-by-step, beginner-friendly tutorial on how to build an end-to-end Machine Learning Pipeline with PyCaret and…
Time Series Anomaly Detection with PyCaret
A step-by-step tutorial on unsupervised anomaly detection for time series data using PyCaret
Supercharge your Machine Learning Experiments with PyCaret and Gradio
A step-by-step tutorial to develop and interact with machine learning pipelines rapidly
Multiple Time Series Forecasting with PyCaret
A step-by-step tutorial on forecasting multiple time series using PyCaret
Bio: Moez Ali is a Data Scientist, and is Founder & Author of PyCaret.
Original. Reposted with permission.
Related:
Top Stories Past 30 Days
|
|
PlatoAi. Web3 Reimagined. Data Intelligence Amplified.
Source: https://www.kdnuggets.com/2021/07/pycaret-predict-customer-churn-right-way.html

