We continue our deep dive series with a focus on Facebook parent Meta Platforms. We will focus as ever on traditional DCF cash flow analysis as well as a relative valuation model to forecast a 12-month price target. We will outline where the standard margin and revenue assumptions predict Meta to trade at, and then outline our own margin and revenue assumptions using current macroeconomic valuation models, while adjusting them to reflect the potential for ratios to retrace to lower levels in a likely coming US economic recession. Finally, we will combine this with a technical overview of the stock to come up with our definitive META stock price target for the next 12 months.
Contents
- Company overview and history
- Wall Street consensus forecasts
- Key valuation rating metrics
- Peer value comparison
- Macroeconomic backdrop, market cycle and sector analysis
- Recent news and earnings
- Forecast and valuation
- Technical analysis
- Executive summary, recommendation and price target
Meta Platforms (META) company overview and history
Facebook was founded in October 2003 and launched as FaceMash, before becoming The Facebook in February 2004 and finally just Facebook in 2005. Facebook launched on the Nasdaq on May 18, 2012, via an IPO that valued it at over $100 billion, the third-largest IPO of all time by a US company. Post-IPO, Facebook shares declined nearly 50% as investors grappled with a similar issue to what is currently facing the company: its outlook.
Back in 2012 Facebook bet the house on mobile as it reckoned smartphone apps were the key to future growth. Fast forward to current times and just interchange the metaverse for mobile apps and you have the same outcome. The company is now betting the house on the metaverse, and investors are once again taking a negative view with the stock falling about 50% this year. “Fool me once” springs to mind, but we will see.
Facebook traded under the ticker FB for its first decade, but last quarter it changed its name and ticker to Meta Platforms and META, respectively, to reflect the firm’s growing investment in the metaverse. Meta is the world’s largest social media network with nearly 2 billion active users. It operates across the Facebook, WhatsApp and Instagram platforms and largely relies on advertising for revenue generation. Meta also utilizes in-app purchasing via games and advertising that generates additional revenue.
Also read: Apple Stock Deep Dive: AAPL price target at $100 on falling 2023 revenues
Meta Platforms derives the majority of its revenue from the US and Canada, and it is forecasting this to increase over the next two years while growth in Asia and Europe suffers. Advertising and the family of apps basically account for practically all of Meta’s revenue stream currently but also is forecasted to remain that way until the end of 2024. This is despite the huge investment in the metaverse currently being undertaken. It forecasts Reality Labs, which is its metaverse unit, to grow from 1% to 2% of revenue by the end of 2024 despite actual revenue being forecast to more than treble in the same time period.
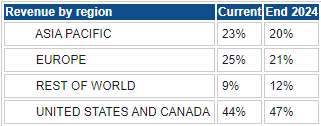
Source: Refinitiv and FXStreet calculations
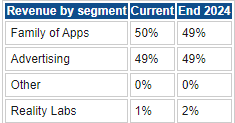
Source: Refinitiv and FXStreet calculations
Like many stocks, especially in the technology space, Meta performed impressively when bouncing from the March 2020 pandemic lows. Meta stock rallied over 100% to the high point in September 2021. This was more or less tick for tick with the Nasdaq (QQQ) performance while significantly ahead of the S&P 500 (SPY).
Facebook Meta (green line) versus SPY (orange line) and Nasdaq QQQ (blue line).
2022 has not been as kind though, and Meta Platforms suffered from its quarterly report in February given the bearish market overall. It has never bounced since in any meaningful way and is now down 53% year to date. The percentage loss in META for 2022 is more than double the loss for the Nasdaq or S&P 500.

META stock weekly performance vs S&P500 and Nasdaq100
Meta Platforms: Wall Street consensus forecasts
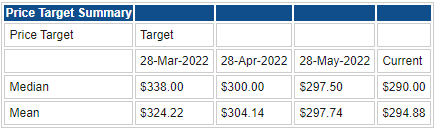
Source: Refinitiv
Despite the meltdown, after those February earnings numbers, the Wall Street analyst community remains positive on Meta. The average 12-month price target is a considerable one at $294.88 versus the current price of $160.60, a massive 83% premium above the current META stock price. An optimistic bunch, those Wall Street analysts. They have been chasing the price and over the past three months have lowered the price target from $324 to $294. Wall Street analysts are always behind the curve as the chart below illustrates.

Facebook Meta stock price (yellow) versus average analyst price target (purple) Source: Refinitiv
Meta Platforms: Key valuation rating metrics

Source: TradingView, Refinitiv and FXStreet calculations
Meta Platforms: Peer Value Comparison
Meta Platforms has seen its valuation totally revert to the mean after its earnings meltdown in February. The P/E is now actually below the S&P 500 average and below every major competitor. This is despite running incredibly high margins and free cash flow generation relative to peers. Facebook in our view though is essentially an advertising company, so comparison with the advertising industry is also relevant. However, even a cursory glance toward WPP and Nielsen shows that Meta looks like it offers a relatively cheaper valuation based solely on P/E ratios.

Source: TradingView, Refinitiv and FXStreet calculations
Meta Platforms: Macroeconomic backdrop, market cycle and sector analysis
We are in a bear market across all main indices, the S&P 500 and the Nasdaq. The economy is slowing both globally and in the US. As we have seen above Meta is a global company that generates its revenues across a global geographic segment. With a slowing economy and tightening financial conditions, it is no surprise that advertising budgets have been reduced. Many of the pandemic beneficiaries have already retraced to pre-pandemic levels, Meta Platforms included. The main indices are still some way short of retracing back to February 2020 levels though, and that may be a warning sign of more potential losses to come.
Also read: Amazon Stock Deep Dive: AMZN price target at $106 with near-term risks offset by long-term growth
Apologies for the repetition if you are a regular reader, but on average bear markets last 12 months and result in an average decline of 40%. Without a recession, that average decline is closer to 30%. We are becoming increasingly confident though that the US will enter a recession this year or in 2023. The University of Michigan’s Consumer Sentiment reading fell to a record low last week, and the Fed remains in inflation-fighting mode as its hands are tied. The bond markets are also becoming more certain of an imminent US recession and have begun lowering rate estimates for 2023.
Currently, the market is expecting interest rates to peak in early 2023 and then begin to fall. This would make the current hiking cycle one of the fastest and most aggressive on record. Economies do not react well to a sudden sharp hike in interest rates. Consumers need to have their expectations gradually changed, so they can prepare, steadily slow down consumption, and change behavior. However, with inflation raging the Fed has been forced into a dramatic pivot, and so consumers are facing the shock and awe of surging prices and surging interest rates. Not a good combination for any economy.
With a potential 40% decline for the main indices, we are just over halfway through and appear to have more room to the downside. This may be triggered after the next earnings season. At present, the S&P 500 is trading on about 15 times forward earnings and 20 times historical earnings. Both are close to long-term averages. But what happens to those averages in times of recession is what we need to focus on.

In the last three recessions, analysts forecasts missed by -33%, -46% and -25%. The synchronized slowdown in Global PMIs suggests that a high probability of EPS being 20% below current forecasts in the coming year pic.twitter.com/UnoWGick13
— Ian Harnett (@IanRHarnett) June 26, 2022
Taking forward earnings for 2023 back lower by 10% and pricing a multiple of 15 on forward earnings gets the S&P 500 (SPX) back to near 3,300. Interestingly that is where the index was before the pandemic. Another 10% downside at least and we will need to factor this into our average price target calculations, which we go through below.
Advertising sector
Meta derives the majority of its revenue stream from digital advertising, and we see more headwinds for advertising spending. According to Forbes, the 2008 Great Financial Crisis saw advertising spending drop by 13%, while Insider Intelligence puts that figure closer to 20%. Regardless, we have had warnings from Meta itself and backed up by SNAP that the online digital advertising space is slowing. Meta is in a strong position though as data from InsiderIntelligence below shows. Facebook and Instagram combined would have the most average time spent per day on social media platforms. While Facebook may be slowing in terms of its original use, incremental evidence shows it is increasingly becoming an important tool for businesses.

Source: emarketer.com
Meta Platforms: Recent news and earnings
Let us take a step back just to recap the shock and awe earnings that Facebook’s parent reported in February this year. Back then the company reported earnings per share of $3.67 versus Wall Street estimates of $3.84. Revenue was $33.67 billion versus a consensus of $33.4 billion. User growth was slowing and missed estimates. Daily active users (DAUs) 1.93 billion versus 1.95 billion expected. Monthly Active Users (MAUs) 2.91 billion versus 2.95 billion expected.
The real issue was the downbeat outlook as Meta commented on challenges from changes to Apple’s privacy iOS, inflation and supply chain issues. This resulted in META shares falling 26% on the release and falling a further 25% in the following two weeks. Facebook shares have never recovered. Q1 results in April were mixed with revenue missing estimates and EPS ahead. That gave the stock a lift on April 28, but META stock has been unable to hold those gains. The next earnings release is due on July 27.
Also read: Tesla Stock Deep Dive: Price target at $400 on China headwinds, margin compression, lower deliveries
Meta Platforms: Forecast and valuation
We start our valuation of Meta using the average analyst and company forecasts. The biggest assumption we have to make when using a discounted cash flow is the expected growth rate. The normal means in corporate finance is to use a historical inflation or interest rate average, but as with any future analysis, there always have to be some assumptions. We have used 4% as inflation, and interest rates are rising despite Facebook itself slowing. This also gives some accountancy to the possibility that the metaverse hits a home run!
Using these forecasts gives us a predicted target price of $282, significantly above the current Meta price of $161. However, we feel current projections are too high and that Meta Platforms will suffer both in terms of revenue and margins. We outline our more conservative projections in the second table below. We base this forecast from the lowest estimates from Refinitiv in both revenue and margins as well as our own estimates.

Source: Refinitiv and FXStreet calculations
We have reduced our revenue and margin predictions to a potential worst-case scenario. In addition, we have lowered the terminal growth rate to 1%. In effect, we are trying to identify the worst-case scenario. This results in an estimated fair value of $179. Again, this is still at a premium to current levels. What we cannot model for are potential changes to government policy and legislation against all big tech and social media companies. The European Union, in particular, is stepping up its scrutiny of the sector, which could result in further headwinds. However, this type of event is difficult to accurately model just as the changes to Apple’s iOS privacy settings were a left-field event for Meta.

Source: Refinitiv and FXStreet calculations
If we turn to a more comparative price/earnings model, we can also outline estimated and worst-case scenarios based on the current average price/earnings ratio for Meta and the overall equity market. In the table below we again use average forecasts from Refinitiv and the worst-case outlook. However, we use the worst case for revenue and margins. This gives expected earnings per share of $13.81 or $10.62 for Meta.

Source: Refinitiv and FXStreet calculations
Using $13.81 or $10.62, we next look at a historical average price-to-earnings ratio for Meta. We can see from the chart below the early stages of Meta saw a very high multiple being placed on the stock in line with many of the other big tech FAANG names. This has given a 10-year P/E average of 30.42, which we think is too high. The current level of 13 is the bottom of the range. Taking our worst-case EPS of $10.62 and using 13 gives a price target of $138. We think it unlikely Meta’s P/E falls below 13. This is not only low for Facebook but is also low for the Nasdaq and S&P 500 as we have shown above.
Our worst-case scenario then gives us a price target of $138 or $179 using the DCF model above. Our worst-case scenario has assumed gross margins will not fall below 70%. The second chart below shows this has happened in the past but not since the Great Financial Crisis and even then only briefly.
Overall, even a modest move to 15 for the price/earnings ratio gives us an average price target of $159 to $179 based on the low estimates provided by Refinitiv and our own DCF model. This is our worst-case scenario.


Meta (META) technical analysis
Valuation models are all well and good, but price is the ultimate indicator, and Meta Platforms stock has been in a powerful downtrend since earnings back in February. The next quarter’s earnings are not until July, and it is unlikely that the stock will get many catalysts until then.
However, there are a few interesting points of note. We have a divergence from both the Relative Strength Index (RSI) and the Money Flow Index (MFI). Both are trending higher, while the stock price is not. Divergences are a classic countertrend indicator, so META may be looking at a turnaround. At current levels, there is not much distance to the pandemic low of $137.10, which represents strong support.

Meta Platforms chart, weekly
Meta Platforms: Executive summary, recommendation and price target
Unfortunately, there is more downside risk for the overall equity market, which will likely lead to further pressure on Meta’s stock price in the short term. We are cautiously bullish on a longer-term time horizon and put a $200 12-month price target on the stock with an obvious buy rating as a result. Technically, we feel the move could target $240 should a bounce materialize. While we have outlined the worst-case price targets above, we believe the strong price target is warranted by the time horizon.
In the short-term, more headwinds are a distinct possibility, but we feel there is the potential for another home run type event if the investment in the metaverse pays off and Facebook has a strong track record of pivoting to the latest trends and moving seamlessly from Facebook to WhatsApp, Instagram to mobile. The fact remains though that the suite of Meta products remains cash generative and a strong advertising partner for all companies. This is unlikely to change even with competition from Tik Tok and other newer entrants. WhatsApp has yet to be fully monetized and provides additional potential for Meta.
Upside risks to our valuation:
- Metaverse home run.
- Market re-rates on P/E and margin outlook.
- US avoids recession.
Downside risks
- Advertising spend falls below GFC levels.
- Deep US recession akin to GFC, meaning valuations and margins fall below our worst-case assumptions.
Reported earnings and forecast tables below from Refinitiv.

Like this article? Help us with some feedback by answering this survey:

