In this episode, we will look at the recent drop of the top crypto assets and what to expect from this drop. As usual, we will consider the factors in favour of the continuation of the downward trend and the signals to look for in the nearest future to identify the local bottom.
[embedded content]
As usual, you can see the four different charts, all related to Bitcoin. The one on the top left is the BTC futures and top right is the BTC dominance and in the bottom, on the left is Bitstamp with the longest history and the one in the bottom right is Binance where we trade. So, let’s go straight into the content.

As usual, we’re starting from the weekly overview, so you can see in front of you the weekly candles. And obviously, the most important thing is that the wall during the past week, we saw a huge move below the 50 Moving Average (MA). And at the same time, this happened over the weekends because the actual candle on the futures was green. So, it means that from Monday till Friday last week or going up and during the weekends we’ve had this huge dump below the 50MA. So, we passed the support level straightaway. On the futures market, we have seen an increase in volume starting from the beginning of the year. So, from January till mid-February, we can see that there was an increase in volume. Now the volume is slightly dropping for the past couple of weeks.
And this can be one of the reasons why it was so easy to pass this particular support of 50MA on a weekly chart. So, let’s switch all our drawings from the previous weeks and go straight into the content.
Bitcoin Futures Price Analysis (CME)

So, go to the daily charts and going into more details on the future market. We expected this drop towards the area of 61 per cent, between 61 and 65 per cent of a Fibonacci retracement. However, it went even further down. You can see that the Monday move. So, starting on early Monday morning, there was still a downward move even further towards the area of 78 per cent of Fibonacci retracement. But this is exactly what we’ve been talking about last time.
So, we saw the retest of the 200 MA as a resistance. And from that point, we saw a huge drop towards the area where we were expecting the Bitcoin to be – 7900 BTC/USD. For now, the volume is not that great, even though it is higher than the volume during the previous week. But we will still want to see at least the higher volume and probably the divergence on the RSI will be another confirmation that we found a local bottom and somebody is buying bitcoin back.
And so that’s exactly what we expect. And based on the idea that we don’t see this yet and that was the move from the downward trend. So probably we’re going to go even further down rechecking this bottom at around 7300 BTC/USD. And this could be a further downward move for Bitcoin. We can probably go down even below 7300 BTC/USD if we’ll see an increase in volume during that time or we’ll see some area of consolidation. Same as we saw during the previous days.
So over here, there was a slight consolidation between the 200 MA and 50 MA. So this is exactly what we would be looking for in the area of 7200 BTC/USD. At the same time, it would be really nice to see the Divergence on the RSI. While the price will go down the RSI will start increasing. And this will be a signal, including the volume that somebody is buying back the Bitcoin at this level. So this is exactly what we’re gonna be looking for. For now, it obviously looks very heavily to the downside. And we’re not talking today about this gap in particular because this is a huge gap and it doesn’t seem and doesn’t look like it’s gonna close within this week.
This will be very surprising. So the example of such huge gaps are here in history and you can see it while going up. So you can see that this gap, for example, on the 14th of June, we had a massive increase of around 6 per cent. And then this gap was filled only during the September retracement of Bitcoin futures. So I wouldn’t say that we’re expecting this gap, in particular, to be filled year in the first week. It would be of later on, but it would not matter. At that time, because statistically, statistically speaking, we are just concerned about the 1-week projection.

What we can see over here, we rechecked the zone of 65-66%. We were expecting to go a little bit higher towards the 200 MA to 68% BTC dominance, but we’ve stuck with 50 MA as a resistance, which is a good sign for us, which means that at this stage, the altcoin market can either depreciate slower, which is not usually the case for them, or we can see that some altcoins will be pumping even though the bitcoin is going down. Usually, there is a negative relationship with MATIC, for example, between BTC and MATIC.
Bitcoin BTC/USD price analysis on Bitstamp

We are using BTC/USD from Bitstamp primarily for the long-term analysis.
So again, the weekly overview. Weekly candles suggest that we’re in quite a good downward trend, even though on the 24th of February, we had a very strong bearish candle. On the second of March, it is still bearish. We crossed the 50 MA. So it’s not acting as a support right now. We are going to the local bottom, so it’s around 6900 BTC/USD.
And it looks like we are going to reach this bottom if it will be so, then our prediction, which we made a couple of weeks ago about this huge move and huge triangle and this is the big resistance line over here, which we didn’t touch yet, which means that we need to find another local bottom at this level of 6800 BTC/USD, an increase in volume, for example. All this will signify that somebody is buying back some of bitcoin and converted into long positions rather than short positions. We should go slightly below the level to take off some stock positions as well. And this will be a wonderful setup for the future growth in April, for example.
Bitcoin BTC/USDT price analysis on Binance
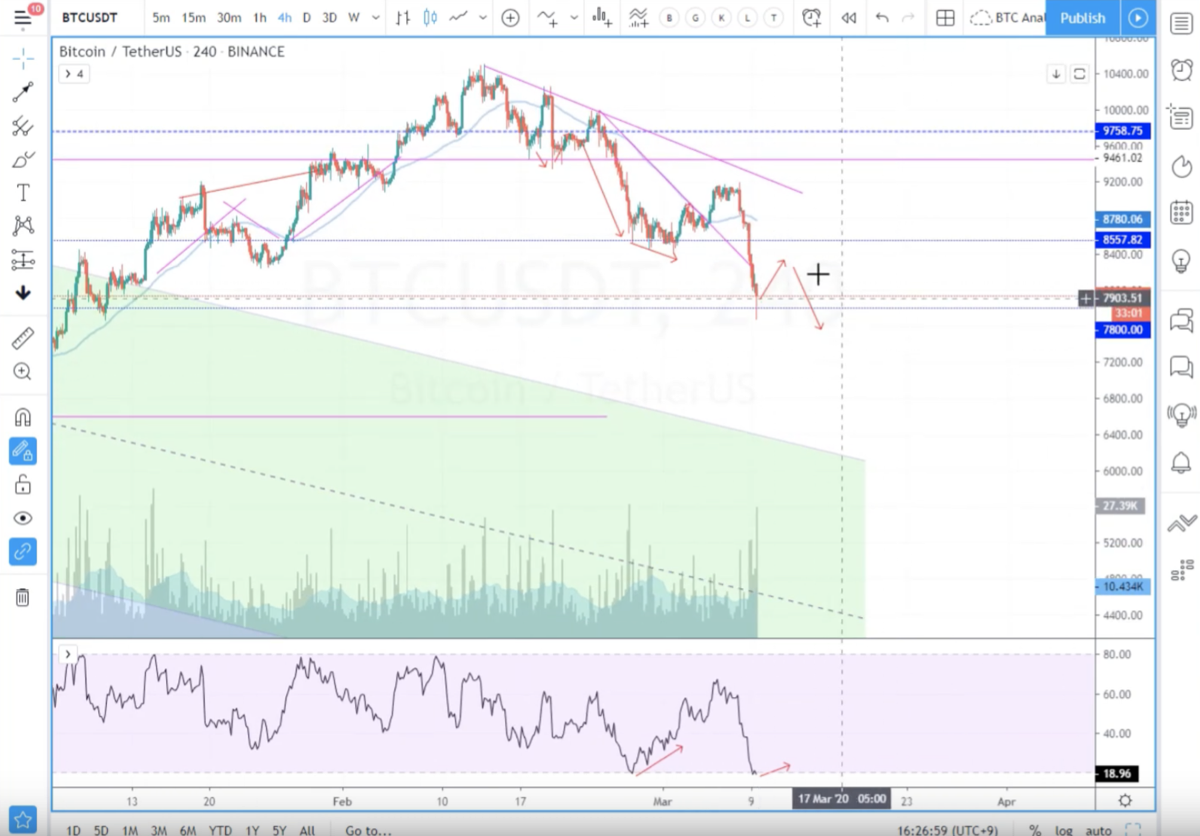
Here we’re talking about the short-term trends. We touched there’s a local downward trend line. As we mentioned last time, it was holding us as resistance for some time. We still went through it. And then the level of 8500 BTC/USDT was broken with a very, very nice volume of very strong bearish candles.
You can see that this move overall went towards the next level of support, which is seven thousand eight hundred, which was a mark for us at this stage. You can see a nice and strong volume here. You can see that the RSI go towards the oversold region, which is quite a good indicator to start buying back a little bit of bitcoin. However, don’t rush into it. The usual confirmation I’m looking for is a divergence. So probably something like this.
We’ll see the retest of around 8300 BTC/USDT or maybe 8000 BTC/USDT because it’s just a good round number. And then another decrease, depreciation of the price to a level of 7600 BTC/USDT and if during that stage will have the RSI divergence on the 4-hour chart. This will be a nice signal to consider that we might see some local bottom and there will be a very short upward trend.
Ethereum ETH/USDT price analysis
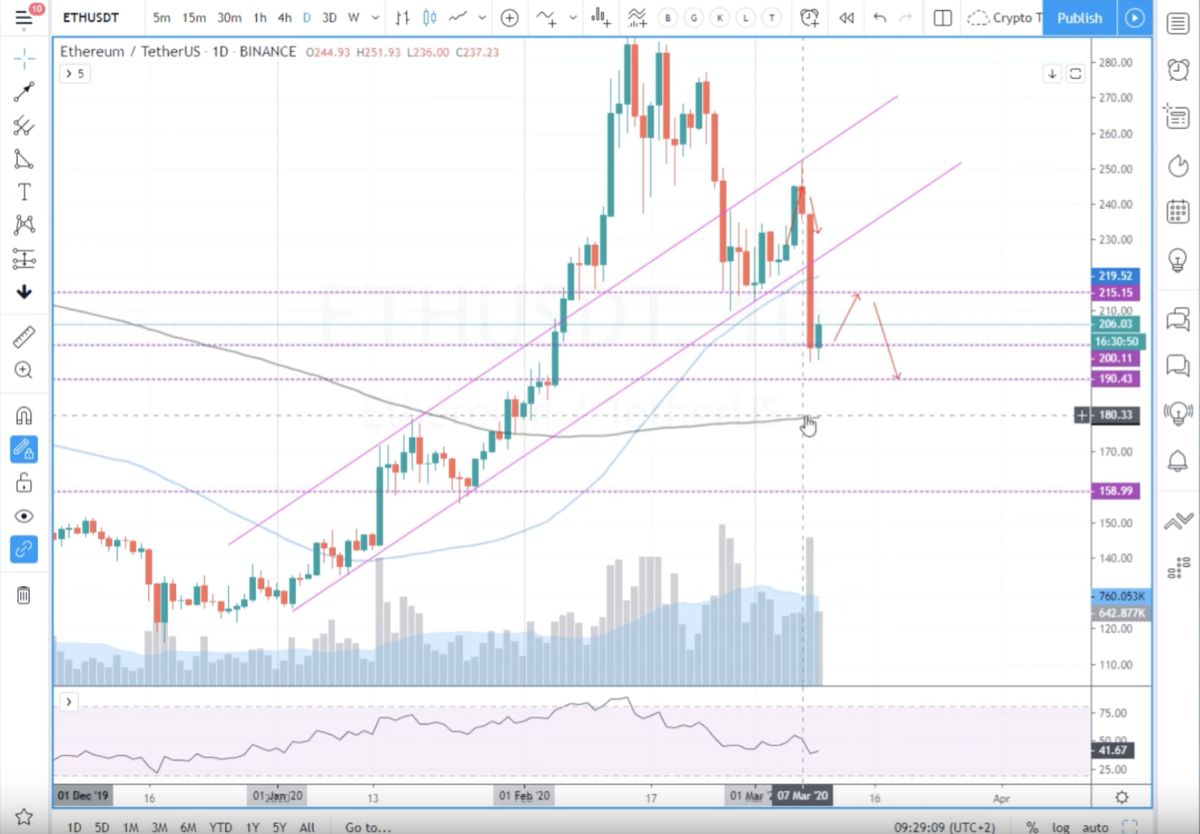
As usual, we’ll start from the weekly candlestick, same as bitcoin. During the previous two weeks, there was a very heavy drop with a very strong volume, especially on the week starting on the 24th of February. A strong bearish candle on the daily chart, we were talking last time that we went into that channel. Bounced from the bottom of the channel and went to the top of that channel and then a very strong candle yesterday, which broke everything, the upward channel, the 50 MA and stopped exactly at the price that we suggested last time – 200 ETH/USDT. And that’s that was exactly the point.
So, 200 ETH/USDT is a nice round number. Usually, the round numbers count as good areas of support and take in the historical overview that it was acting as a support line for several points in history. So what we’re expecting next is a further downward move. We’re currently between 50 MA and the 200 MA. So we’ll be consolidating a little bit, but it will look like this. So we should go and recheck this 50 MA. I mean, go down towards the 190 ETH/USDT. We should break the level of 200 ETH/USDT. This will be quite vital for us if the price will be quite slow in terms of its movement and we’ll stay in that horizontal channel.
So we will be able to see that the 200 MA start slowly to increase and it will act as the support at around 190 ETH/USDT. We don’t see any divergence here. You can definitely put a downward channel through the top like that. This at some point will act as a resistance. But at the same time what we are looking for right now is a short upward move towards the 50 MA to test that as a resistance now and then to check the 200 MA as a support. This can take a slightly more than a week, but again, taking into account what happened during the weekends, you can probably expect that some move towards the end of the week can be absolutely massive.
That was it for this week. Thank you very much. Please subscribe to our YouTube channel to stay tuned with our weekly reviews of Bitcoin and Ethereum price analysis. And best of luck with your cryptocurrency trading.
Copy-trade best traders and bots in crypto
Wunderbit Trading is a platform that allows you to start trading and investing in cryptocurrency seamlessly.
Copy trade the best crypto traders with a transparent track record, trade yourself using the advanced trading terminal or create a fully automated trading bot using TradingView.
Platform is built on top of crypto exchanges and has following features:
1. Advanced trading terminal
2. Copy-trading (traders can auto copy trade other traders or bots)
3. Users can create trading bots on TradingView and automate them with Wunderbit Trading
4. Exchanges are connected using API
5. Platform is free
6. Connected exchanges: Binance, Kraken, Bittrex, FTX
Source: https://wunderbit.co/en/blog/massive-bitcoin-drop-wait-for-the-bottom

