Acknowledgment: Derek Pennings came up with “The Entry Indicator.” I helped him with putting the thought process in writing. You can find him on Twitter @PenningsDerek.
Not Again
It happened. Again. Price dropped more than 50% from its all-time high. During times like these, people wonder whether the bottom is in or not. Nobody wants to sell the bottom. And nobody likes to buy a dip that keeps on dipping either.
There are a lot of indicators. Some of which we call “on-chain” indicators and some are technical price indicators. For example, the relative strength index (RSI) on the daily time frame. When it hits 20 or lower, then it’s really something. Or what about Fibonacci levels? All great indicators to get some sense of price action. But does it make it a great entry indicator? It may be useful, but it’s always relative to the previous price action, which isn’t a fundamental threshold. It’s technical.
Realized Price
So, which indicator has a fundamental threshold? We like to watch the realized price closely. In an earlier written article, we explain how we look at the bitcoin (market) price with the realized price as an anchor. When the price of bitcoin goes below the realized price, it means that, on average, bitcoin HODLers are at a loss. Early investors may still be in profit, but most investors are at a loss.
On January 31, 2022, the realized price was around $23,900. In the history of bitcoin, it rarely happens that the market price reaches this level or even goes below it. But even when it happens, it doesn’t exactly mark the bottom. Yes, it’s a darn good place to stack some extra sats, but will the price stop from dropping at this level? On January 14, 2015, it most certainly did not. With a realized price of $310.91 and a market price of $172.21, it went a lot lower. Maybe this was because the second peak of the 2013 bull market was an outlier, and the realized price was front running the “normal tech adoption curve.” We might elaborate on that hypothesis in a different article, but for now, let’s focus on an entry spot.
Adjusted Realized Price
There were times that the bitcoin price went through a large correction and the price recovered again before touching or getting near the realized price. Since 2020, large investors are stepping in and are changing the rules of the game. Michael Saylor likes to add bitcoin to his balance sheet when the price drops and President Bukele is also smashing the buy button on his phone when price dips. So, it might take years for the bitcoin price to reach the realized price again. It may never happen again, ever. Are you willing to wait for that?
So, what if we adjust the realized price for lost coins. Coins that haven’t been moved for over seven years, may never move again. The adjusted realized price is around $30,649 (depends on how you calculate it). This might sound more realistic. We already saw a wick to $33,000. But even this adjusted realized price isn’t always a perfect entry indicator.
Framework For An Entry Indicator
But what makes an entry indicator a good entry indicator? Let’s think about it. There are a couple of factors that you want to account for. The first is the moment in time. Because the rate of bitcoin that inflates the total circulating supply halves every four years, you might consider buying if a halving is near or you might wait longer if a halving just happened 18 months ago and the next one is still 30 months away.
The second is the difference between the expected valuation of bitcoin during that certain halving period and the actual market price. If the current price is way lower than the expected price, you might consider buying, and if the price is at par or higher, you might want to wait for a lower price.
The third is the current state of the market. Are short-term holders freaking out again and panic selling? Are long-term holders keeping their faith or are diamond hands even turning into paper hands?
Stock-To-Flow Deflection
Almost everyone in the Bitcoin space heard about the stock-to-flow (S2F) model. It values bitcoin by its scarcity. The deflection is the current price divided by the valuation of the stock-to-flow model. Stock-to-flow became a very controversial model. It probably is (way) too bullish in the long run, because it doesn’t have diminishing returns built in, yet there is empirical evidence that there are diminishing returns in bitcoin.

But the model could still be very useful. What it does is value the price of bitcoin during a specific halving (expectation). And it is useful to distinguish which period you find yourself in between halvings (time). Even if the expected value of S2F will be proven to be too high, it still can be used in an entry indicator. Why? Because we are creating a ratio and if the S2F price is too high, the “green zone” of the ratio will be lower than if S2F was (entirely) correct.
Percent Of Supply In Profit
With the S2F deflection having both the expected valuation and time covered, we still have to deal with behavior and sentiment to find a great entry point. To get a feeling about what the sentiment is during a correction, it’s useful to watch how many people are under water with their bitcoin purchase. This is possible with the metric of percent of supply in profit, because if 70% of the supply is in profit, 30% isn’t.
Since the bitcoin price has only gone up on a high time frame, one could state that it would be new market participants which have the highest chance of getting in an unrealized loss position. We also know that the younger the coins, the higher the probability they will be sold. Therefore, the probability that new participants are the panic sellers, which sell at a loss, is very high compared to investors who have been in the market longer.
The influence of percent of supply in profit (PSiP) is very important for identifying a bottom and thus a great entry. When the PSiP goes down during a correction and rises again, it means paper hands sold their bitcoin. Chances are that if enough bitcoin has been sold at a loss, the bottom begins to form. The new owners aren’t at a loss and won’t sell the newly acquired bitcoin anytime soon. Typically, these new owners are also investors who have a strong conviction and have been through multiple severe corrections.
If the PSiP is still low and keeps going lower, it means that paper hands still have enough hopium and capitulation needs to kick in before a bottom will form.
The Entry Indicator
Multiplying stock-to-flow deflection (S2FD) with the PSiP gives a value ranging from 0.15 up to one. Only when the market price exceeds the S2F value, the indicator also goes higher, like the blow-off tops in 2011, 2013 and 2014. One could also notice that the bottoms of this metric are forming slightly lower lows over time, which would indicate that the bottom value would be descending over time. The descending of the bottom could be an indicator that S2F valuation is too bullish, but we’ll leave that open for debate.
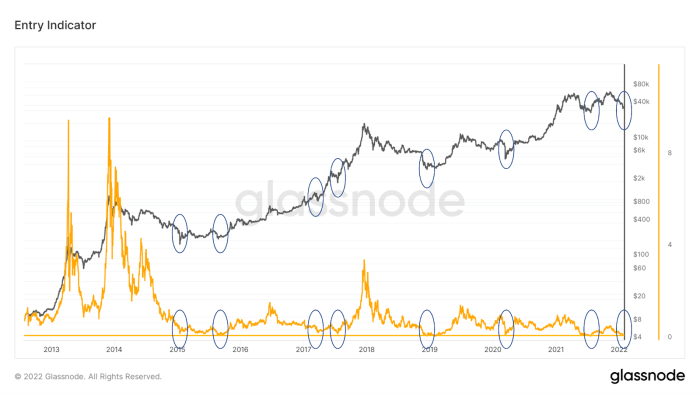
Image source: Glassnode
When the indicator comes near 0.2, historically, it has always been a great entry point. Note that these buying moments are also shown outside of bear markets. One could see that two buying opportunities are nicely presented in the bull run of 2017, but surprisingly also in mid-2021 and in the most recent one in January 2022.
Dynamics
The dynamics between the S2FD and PSiP is extraordinary. Let’s take January 6, 2021, for example. The market price was $36,850 and the S2FD was 0.987, and thus, the S2F price was $ 37,340. The PSiP was 100%. So every (on-chain) bitcoin HODLer was at profit. The entry indicator (TEI) gives 0.987 times 100% which equals 0.987. So, the price was almost at par. Nobody was at a loss and price was at the expected level for this epoch thus it wasn’t a great entry point.
Let’s look at moments in time when there was a big correction. On August 25, 2015, the price fell to $211.04 while S2FD was 0.578 and PSiP was 36.5%. TEI gave 0.21.
Fast-forward to December 15, 2018, the price was $3,255 and S2FD was 0.463 and PSiP was 40.18%. TEI gave 0.186. Slightly more HODLers were
in profit than back in 2015, but the deflection between market price and S2F price was larger.
One could get a great entry during a bear market, but even during a bull market such entries will present themselves. After reaching a new all-time high of $2,991 on June 11, 2017, we pulled back to $1,914 within weeks. With a PSiP of 78%, one could discuss if this would make a great entry. However, the S2FD was 0.35 resulting in a TEI of 0.273. In hindsight, it actually was a great entry point despite being in the midst of a bull run.
The same happened in the spring of 2021. On July 19, 2021, the bitcoin price was $30,834 and S2FD was 0.279, but PSiP was only 65.8%, which gave TEI 0.177. The outcome is almost the same as in 2018 and 2015, but it has a different structure. In 2015 and 2018, the S2F.D was less severe, but the supply at a loss was larger. In 2021, the S2FD was really large, which resulted in a low number, but the supply at a loss wasn’t that ugly.
It looks like there is a correlation between the consensus of bitcoin HODLers about the price in each halving period and the amount of (unrealized) loss they will endure during that halving. In 2015, there was consensus about price being relatively high and when price dropped a lot of supply was at a loss. In 2021, there was consensus about price being relatively low, but it also made sure that supply held wasn’t that much exposed to (unrealized) losses.
Over time, it seems that around 0.2 is a very good entry point and almost every time the actual bottom. Spoiler alert, this time, TEI was at 0.2 at $35,000! Time for an entry?
This is a guest post by Johan Bergman. Opinions expressed are entirely their own and do not necessarily reflect those of BTC Inc or Bitcoin Magazine.

