Join Our Telegram channel to stay up to date on breaking news coverage
Litecoin Portrays a Recovery – September 29
Variant declining motions have been staging against some upward moves being attempted in the LTC/USD market operations as the crypto trade bases support on $50 business line over time. Price is trading around the $53.34 value line at an average minute positive percentage rate of 0.13, keeping low and high trading points of $51.36 and $55.63 in the last seven days.
Litecoin (LTC) Statistics:
LTC price now – $53.34
LTC market cap – $3.8 billion
LTC circulating supply – 71.2 million
LTC total supply – 84 million
Coinmarketcap ranking – #21
LTC Trade
Key Levels:
Resistance levels: $60, $70, $80
Support levels: $50, $45, $40
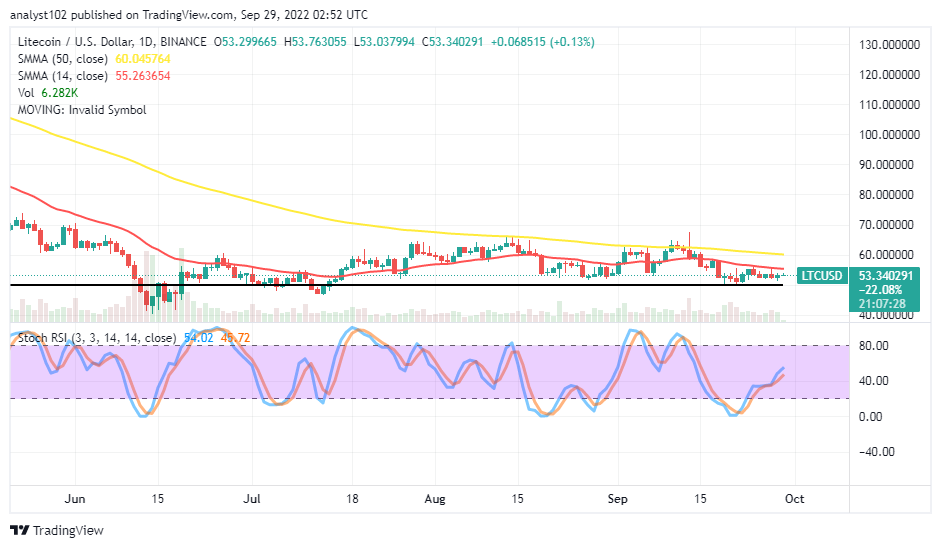 LTC/USD – Daily Chart
The LTC/USD daily chart reveals the crypto market bases support on the $50 trading level most of the time in the recent past and present. Trading activities are currently between the smaller SMA trend line and the horizontal line drawn at the value point mentioned earlier. The 50-day SMA indicator is at $60.05 above the $55.26 value line of the 14-day SMA indicator. The Stochastic Oscillators have crossed northbound from the oversold region to reach 45.72 and 54.02 range values.
Your capital is at risk
Will the LTC/USD market continue to hold around the range-bound zones of $50 and $60 levels?
There has not been any defiant signal indicating a firm change of direction from the range-bound trending outlook it has been maintaining overly as the LTC/USD market bases support finding on the $50 trading level. As a result of that analytical sentiment, buying myth may have to be from the lower range point. And traders will have to eschew any possible panic sell-off situation when the market slowly approaches and tends to move southward around the lower horizontal line drawn in the long run.
On the downside of the technical analysis, some tinier bullish candlesticks have been closely beneath the trend line of the 14-day SMA. It averagely indicated that the crypto trade still has the chance to push upward about 46% capacity. However, if a bearish candlestick surface in no time, Price can move back down to re-ding its stance around the $50 support level. Sellers should be careful of riding alongside such a presumed falling move because of an unprecedented rebound.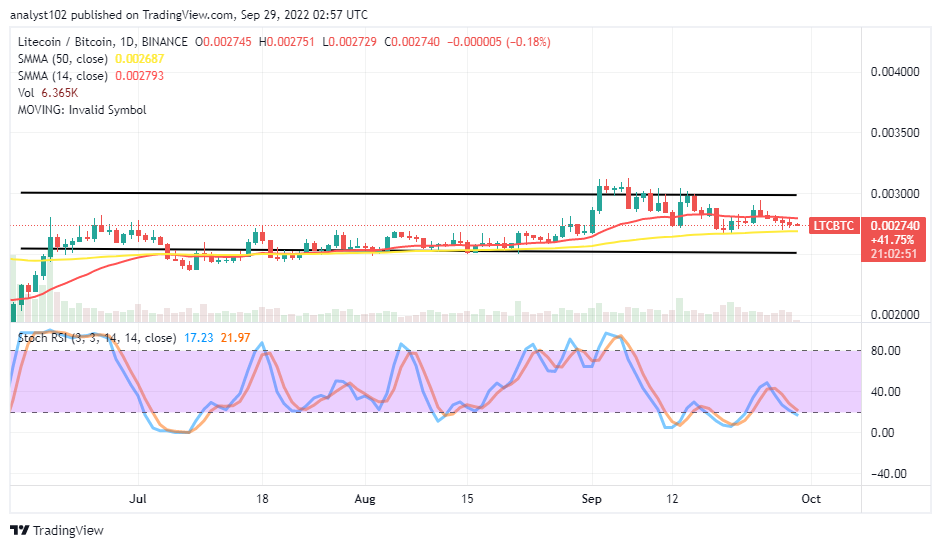

LTC/BTC Price Analysis
In comparison, Litecoin is succumbing to a light correction around the trend line of the smaller SMA against the trending ability of Bitcoin. The cryptocurrency pair price bases support on the trend line of the bigger SMA. The 14-day SMA indicator is on top of the 50-day SMA indicator. The Stochastic Oscillators have been swinging about in the ranges of 40 into the oversold region for a while, And they are around 21.97 and 17.23 range points, pointing toward the downside direction to indicate the base crypto is yet to stop debasing i the retracement moving modem pairing with its counter-trading crypto.
Tamadoge – Play to Earn Meme Coin

- Earn TAMA in Battles With Doge Pets
- Maximum Supply of 2 Bn, Token Burn
- Now Listed on OKX, Bitmart, Uniswap
- Upcoming Listings on LBank, MEXC
Read more:
Join Our Telegram channel to stay up to date on breaking news coverage

