Introduction
The collapse of Terra (LUNA) in June 2022 was the spark that ignited a fire that kept devouring the crypto market. The chain reaction of prominent industry players bankrupting continued throughout the year and culminated with the collapse of FTX, one of the largest crypto exchanges in the industry.
When FTX collapsed, it wiped out billions in client deposits and pushed the market to its three-year low. Bitcoin reached $15,500 and threatened to drop even further as contagion from FTX spread.
Since then, Bitcoin has recovered and posted notable returns, hovering around $23,000 since the end of January 2023.
However, the market still looks unstable. Bankruptcy proceedings for FTX, Celsius, and other large companies are still ongoing and have the potential to cause more price volatility. The incoming recession is creating macro uncertainty that keeps the market grounded.
The industry seems divided — some believe Bitcoin bottomed in November 2022, while others expect more volatility and an even lower low in the coming months.
CryptoSlate looked at factors that could push Bitcoin down to a new low, and factors that show a bottom was set to present both sides of the argument.
While deep diving into the three metrics in the tweet below that analyses a potential market bottom.
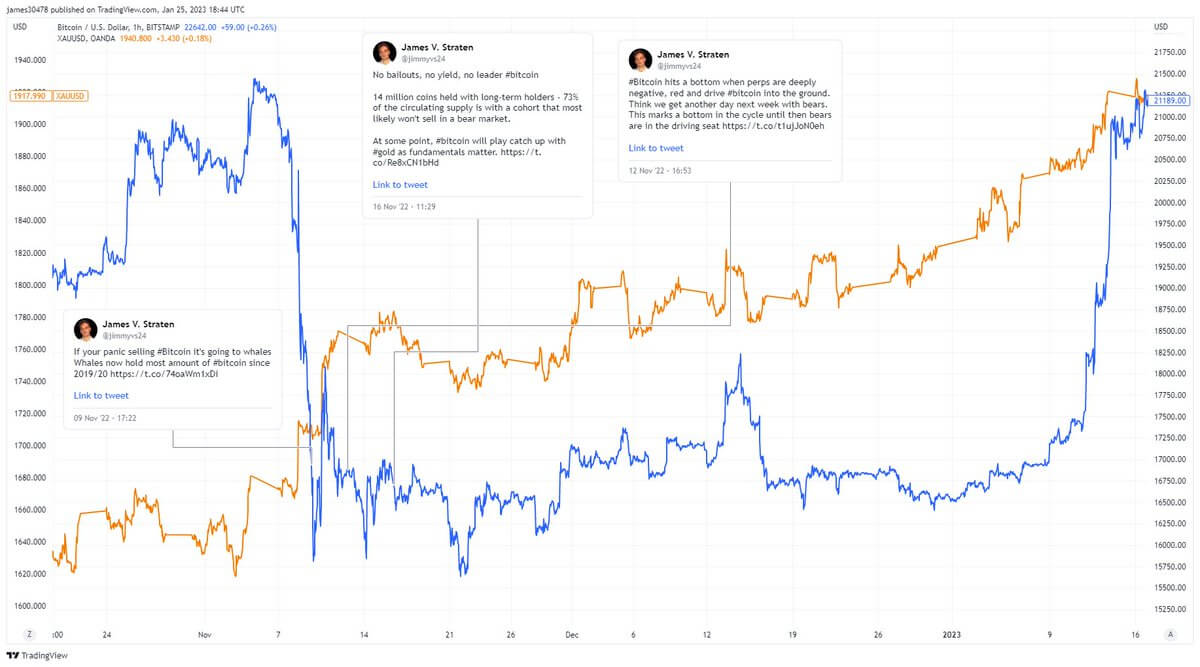
Why the market bottomed – Whales are accumulating
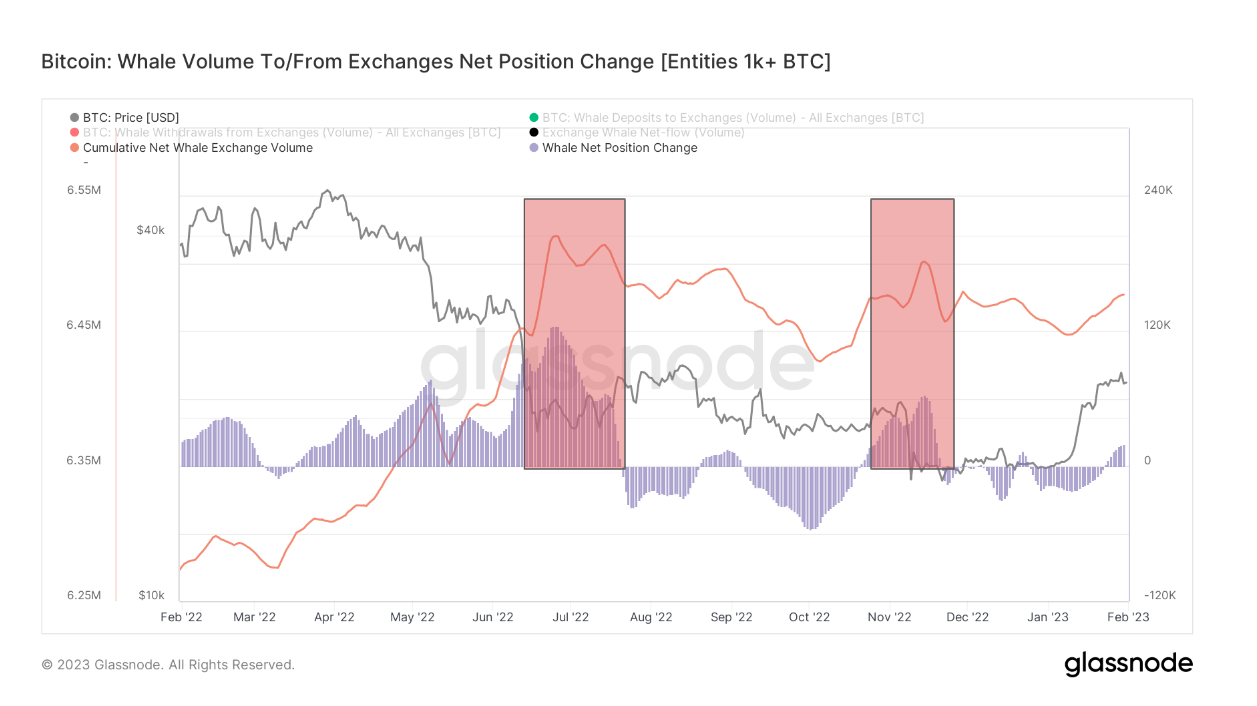
The net position change in addresses holding over 1,000 BTC indicates a strong cycle bottom. These addresses, called whales, have historically accumulated Bitcoin during extreme price volatility.
Whales embarked on a heavy accumulation spree during the Terra collapse in June 2022, scooping up almost 100,000 BTC in just a few weeks. After three months of sell-offs, whales began accumulating again at the end of November 2022, right after the collapse of FTX. Once Bitcoin’s price stabilized in December, whales began selling off their holdings and decreasing their net positions.
And while there has been some increase in whales’ net position at the end of January, exchange volumes don’t suggest massive accumulation.
Long-term holder supply is increasing
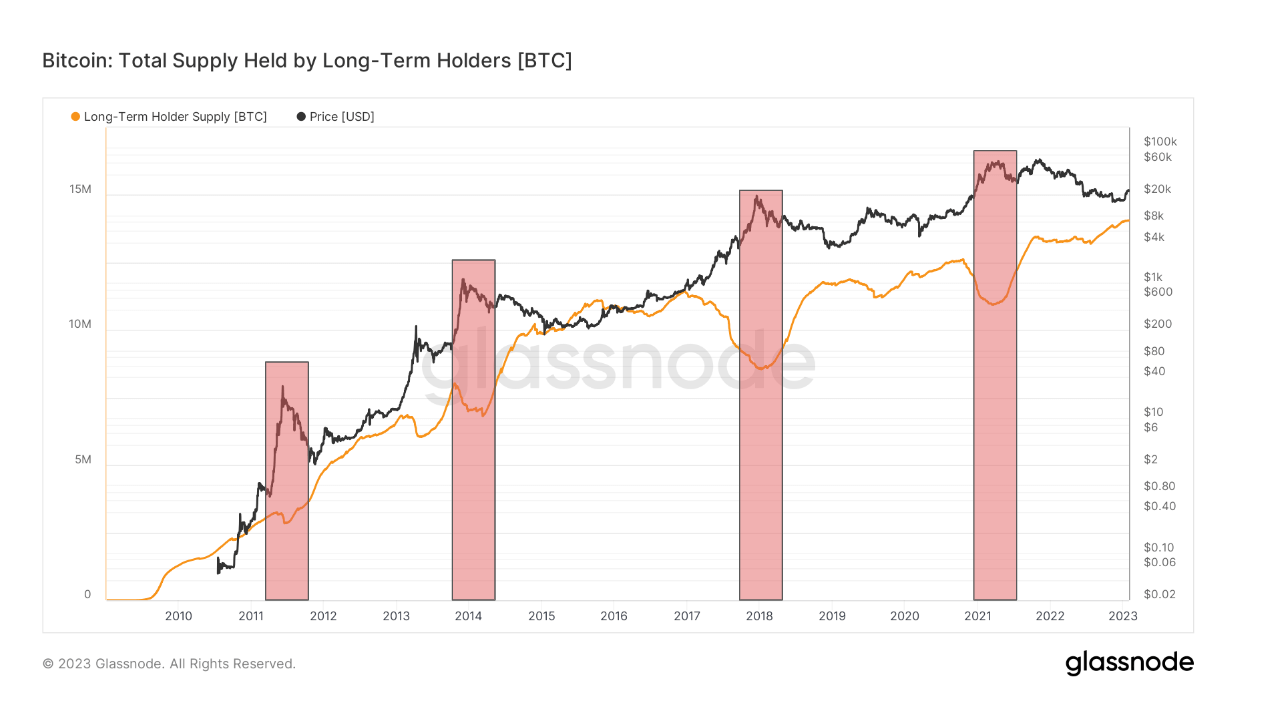
Long-term holders (LTHs) make up the foundation of the Bitcoin market. Defined as addresses holding BTC for over six months, they have historically sold during market tops and accumulated during market bottoms.
The supply of Bitcoin held by long-term holders is often seen as an indicator of market cycles. When the supply increases rapidly, the market tends to bottom. The market could be nearing its top when the supply begins to decrease.
However, the LTH supply isn’t immune to black swan events. A rare exception from this trend occurred in November 2022, when the collapse of FTX pushed many LTHs to decrease their holdings.
But, despite the dip, LTH supply recovered in 2023. Long-term holders hold over 14 million BTC as of February. This represents an increase of over 1 million BTC since the beginning of 2022, with LTHs now holding roughly 75% of Bitcoin’s supply.
CryptoSlate analyzed Glassnode data to find that the LTH supply continues to increase. There’s little sign of capitulation among LTHs, indicating that the bottom could be in.
Perpetual funding rates are no longer negative
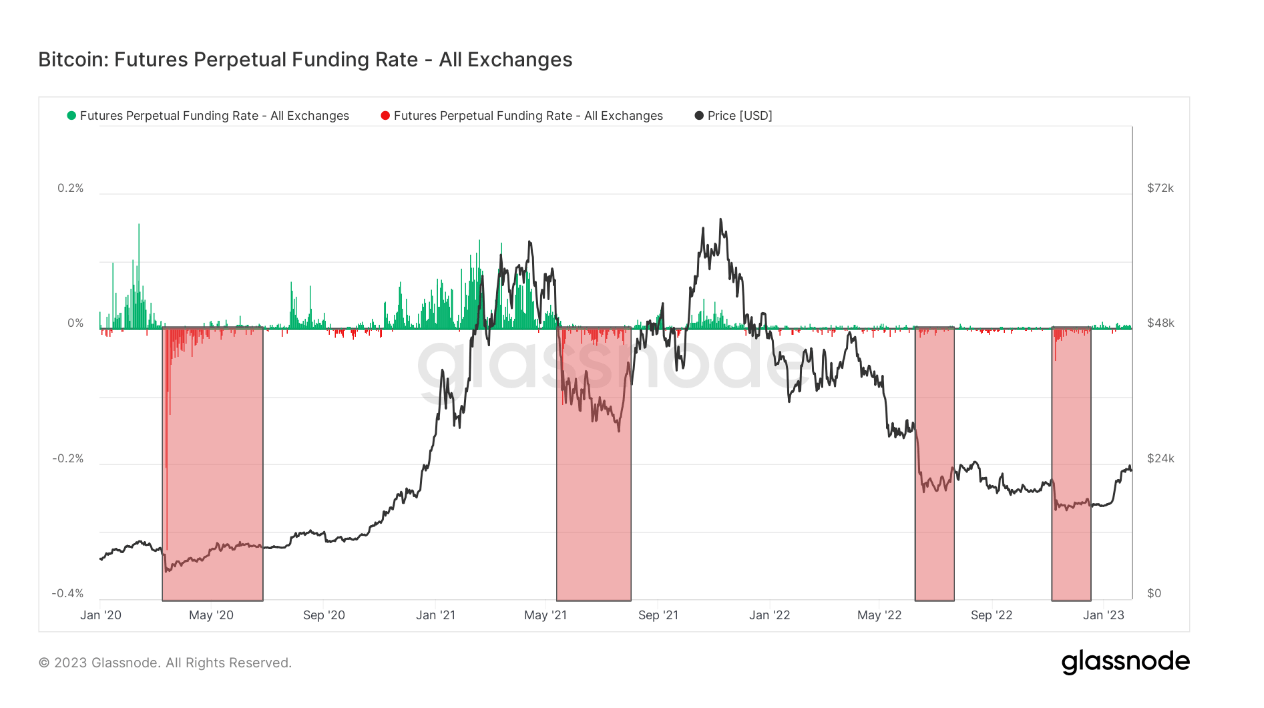
Perpetual futures, native to the crypto market, are a solid gauge of investor confidence in Bitcoin.
Perpetual futures are futures contracts with no expiration dates, allowing investors to close their positions at any time. To keep the contracts’ price consistent with the market value of Bitcoin, exchanges utilize funding rates. When the contract price is higher than BTC’s spot price, long positions pay a fee to short positions. When the contract price is lower than BTC’s spot price, short positions pay the fee to long positions, causing the contract’s price to realign with Bitcoin’s market value.
Positive funding rates indicate more long positions in perpetual futures contracts, showing investors anticipate an increase in Bitcoin’s price. Negative rates show an abundance of short positions and a market gearing up for a decrease in Bitcoin’s price.
Since the beginning of 2020, every time Bitcoin’s price bottomed, the market saw extremely negative funding rates. In 2022, a sharp increase in negative funding rates was seen in June and in November, showing that investors shorted the market heavily during the collapse of Terra and FTX. Sharp spikes in negative rates have always correlated with the market bottom — a large number of short positions in perpetual contracts puts further strain on a struggling market.
Funding rates have been almost entirely positive in 2023. With no data suggesting the onset of extreme spikes in negative funding rates, the market could be in a recovery phase.
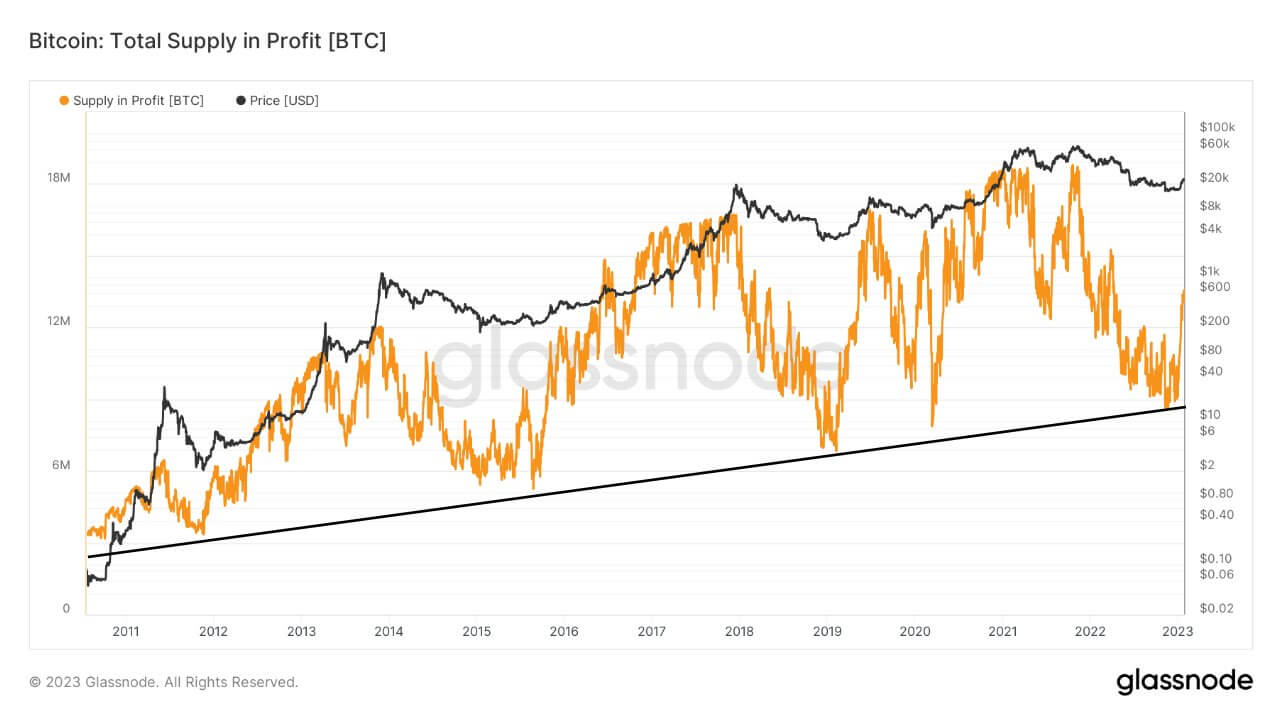
Total supply in profit is growing
The repetitive nature of market cycles enables us to recognize patterns in Bitcoin’s price volatility. Since 2012, every bear market saw Bitcoin post a higher low than in the previous cycle. These lows are measured by calculating the drawdown from the ATH price BTC reached in the cycle.
- 2012 – 93% drawdown from ATH
- 2015 – 85% drawdown from ATH
- 2019 – 84% drawdown from ATH
- 2022 – 77% drawdown from ATH
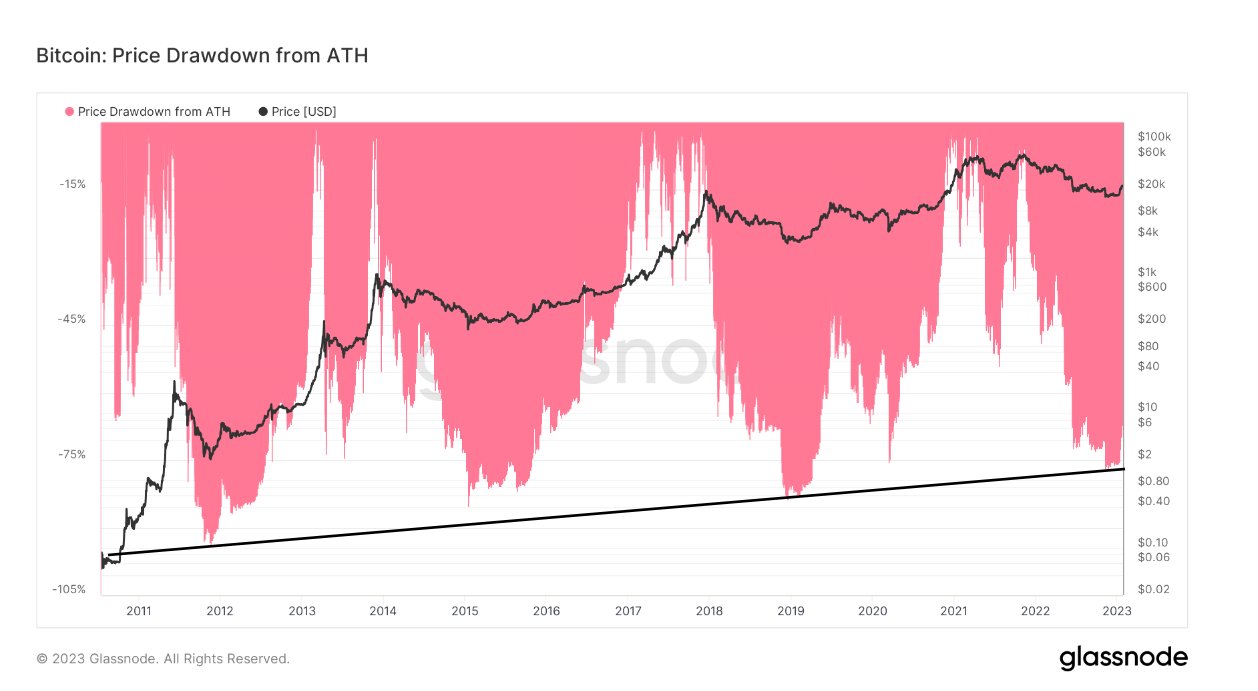
Higher lows each cycle lead to the total supply of Bitcoin in profit getting higher. This is also due to lost coins as this number continues to grow each cycle, essentially becoming a forced hold.
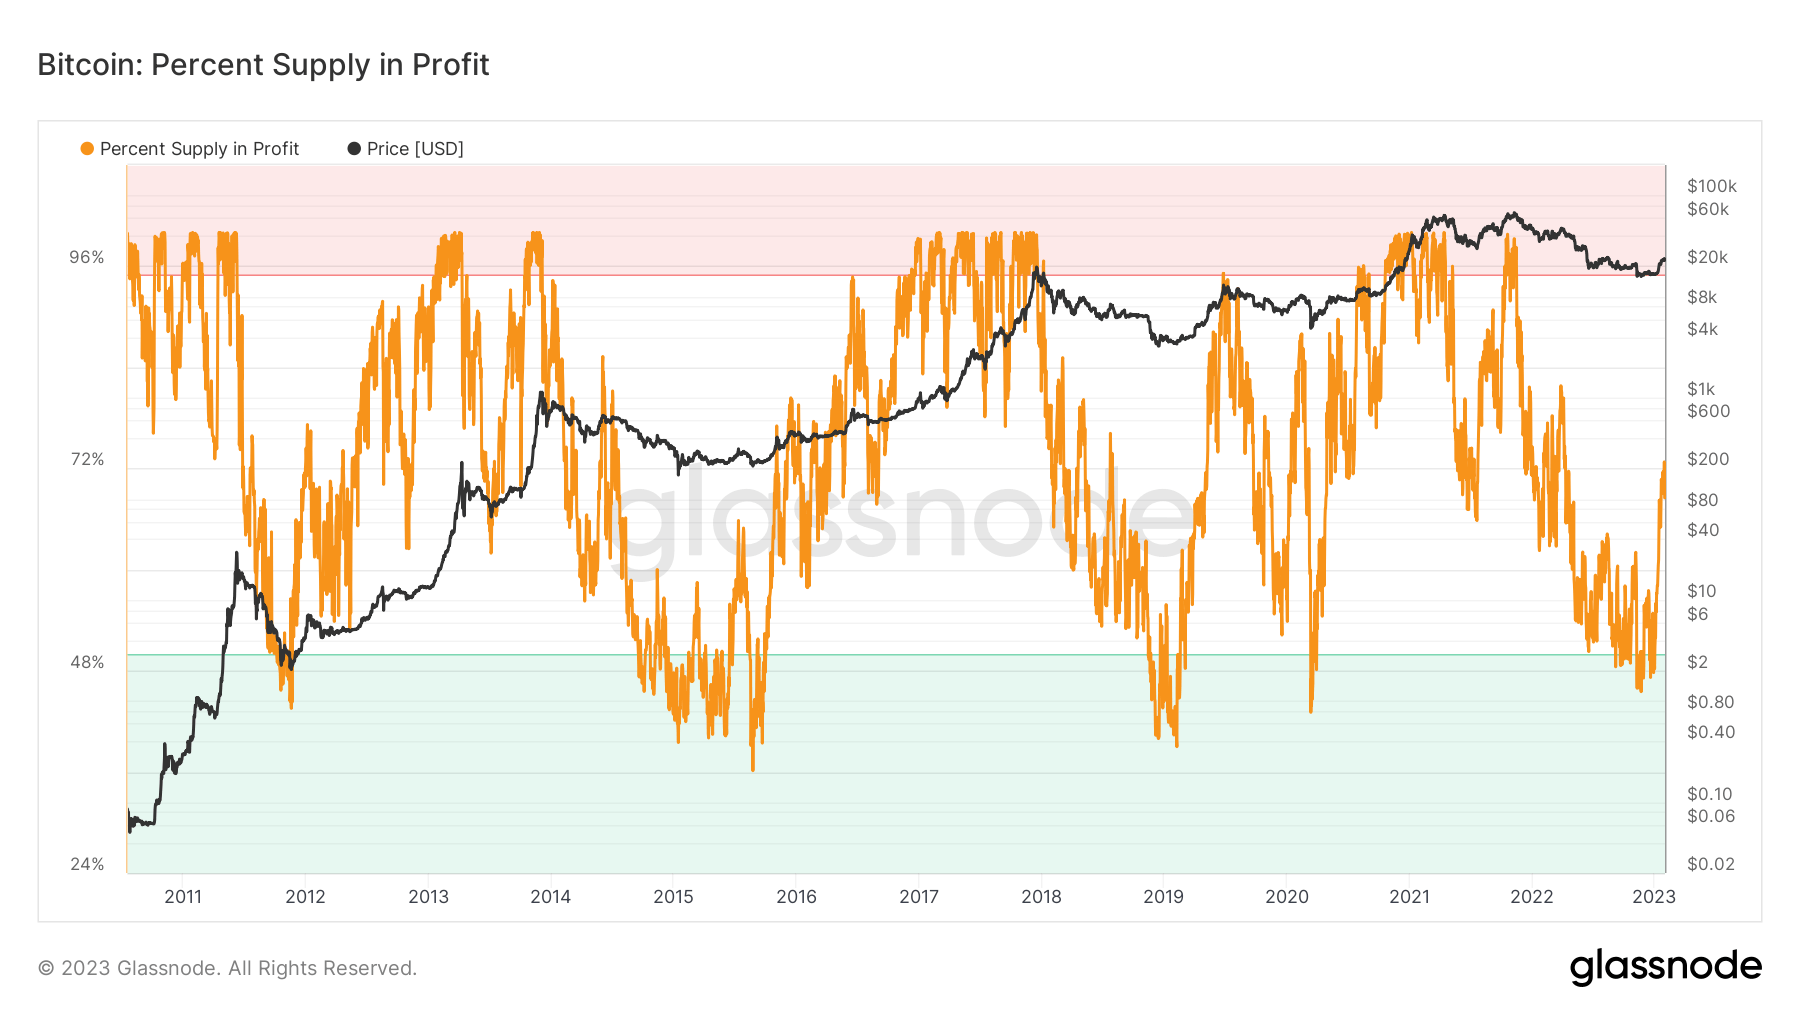
Every time the percent of Bitcoin supply in profit dropped below 50%, a bottom of the cycle was formed. This happened in November 2022, when the supply in profit was as low as 45%. Since then, the supply in profit increased to around 72%, indicating market recovery.
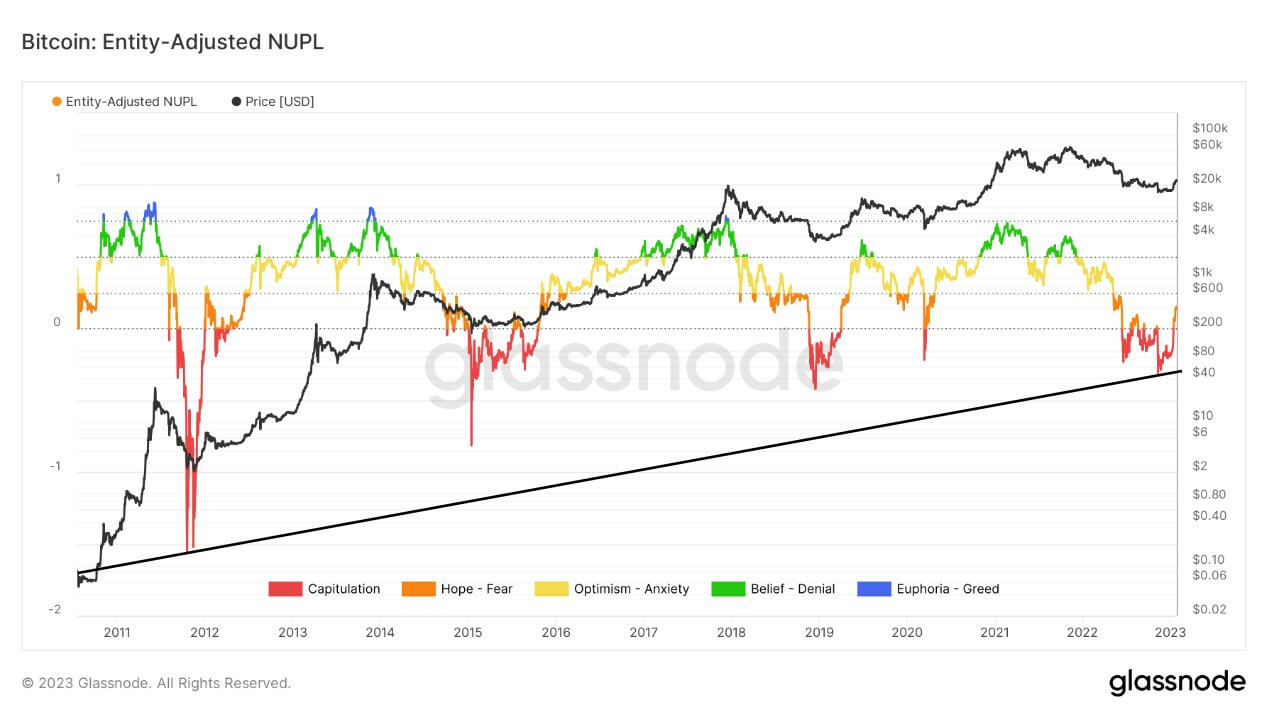
These metrics suggest that the bottom was reached in November with Bitcoin’s drop to $15,500. Net Unrealized Profit/Loss (NUPL), a metric comparing the market value and realized value for Bitcoin, is a good gauge of investor sentiment.
Entity-adjusted NUP currently shows that Bitcoin is out of the capitulation phase and has entered a hope/fear phase, which has historically been a precursor to price growth.
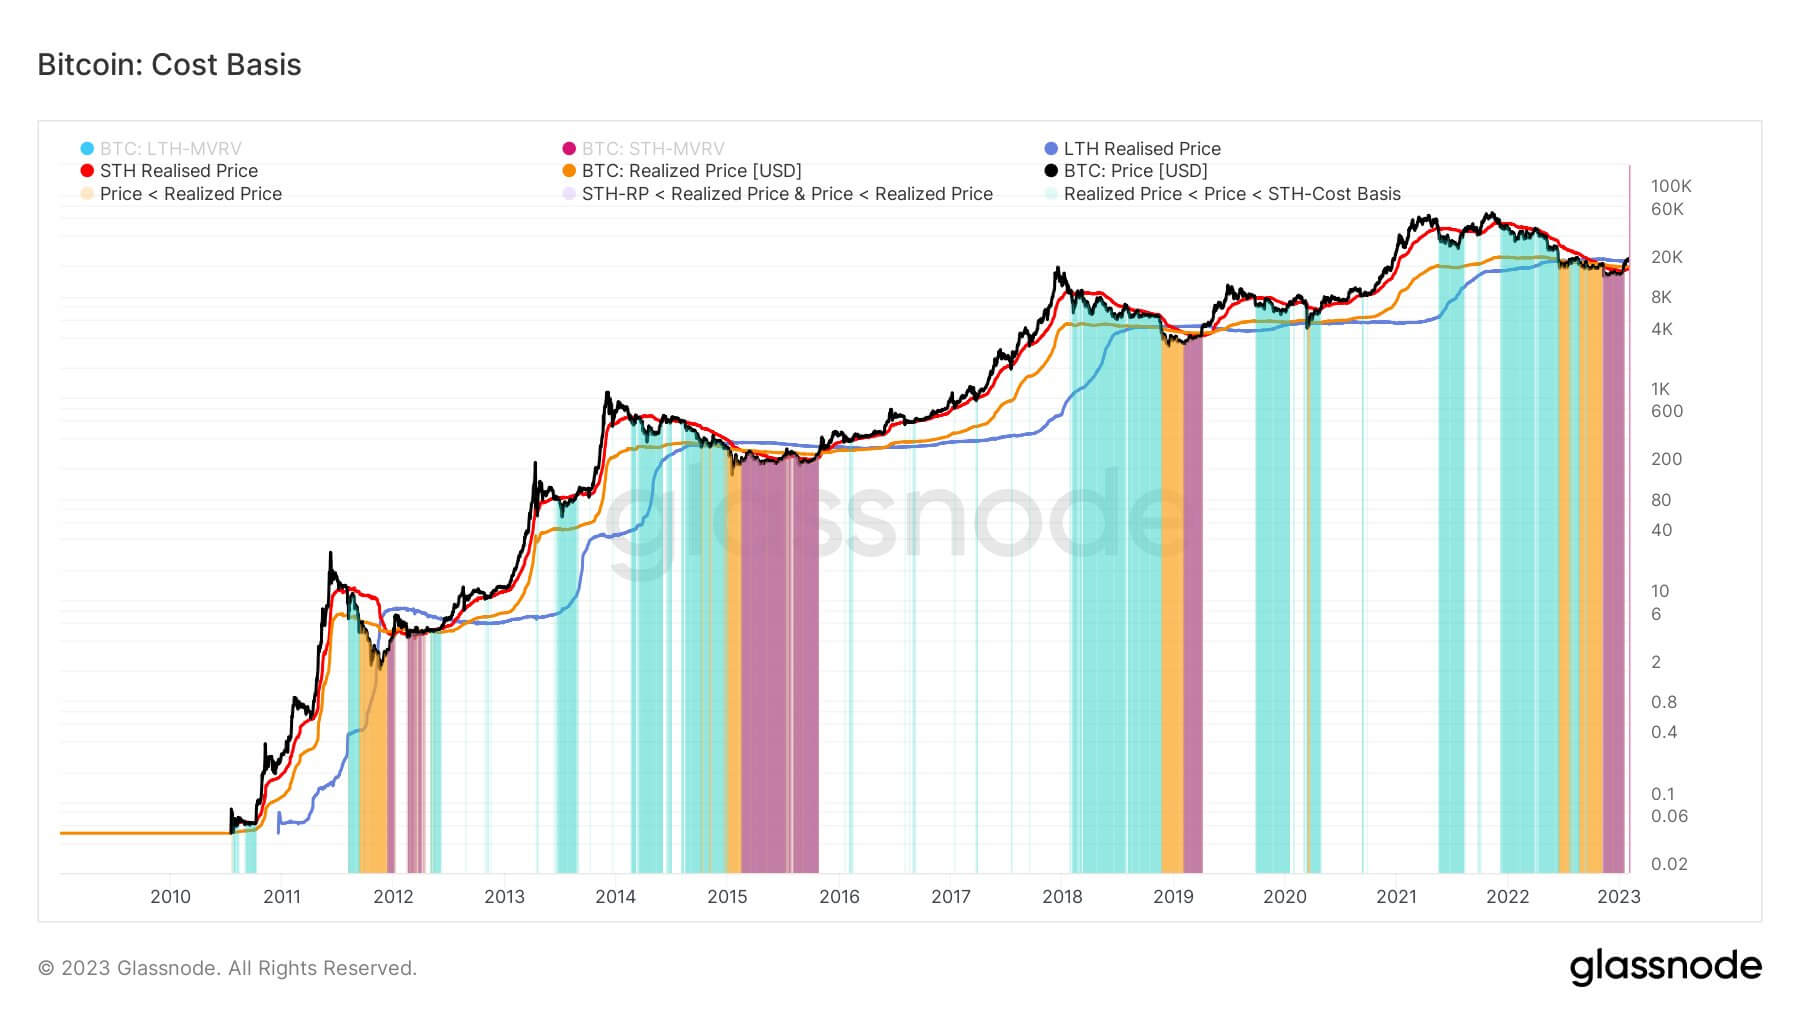
On-chain indicators are flashing green
Since its November drop, Bitcoin has reclaimed multiple cost basis. Each time BTC’s spot price surpassed the realized price, the market began recovering.
As of February 2023, Bitcoin has surpassed the realized price for short-term holders ($18,900), the realized price for long-term holders ($22,300), and the average realized price ($19,777).
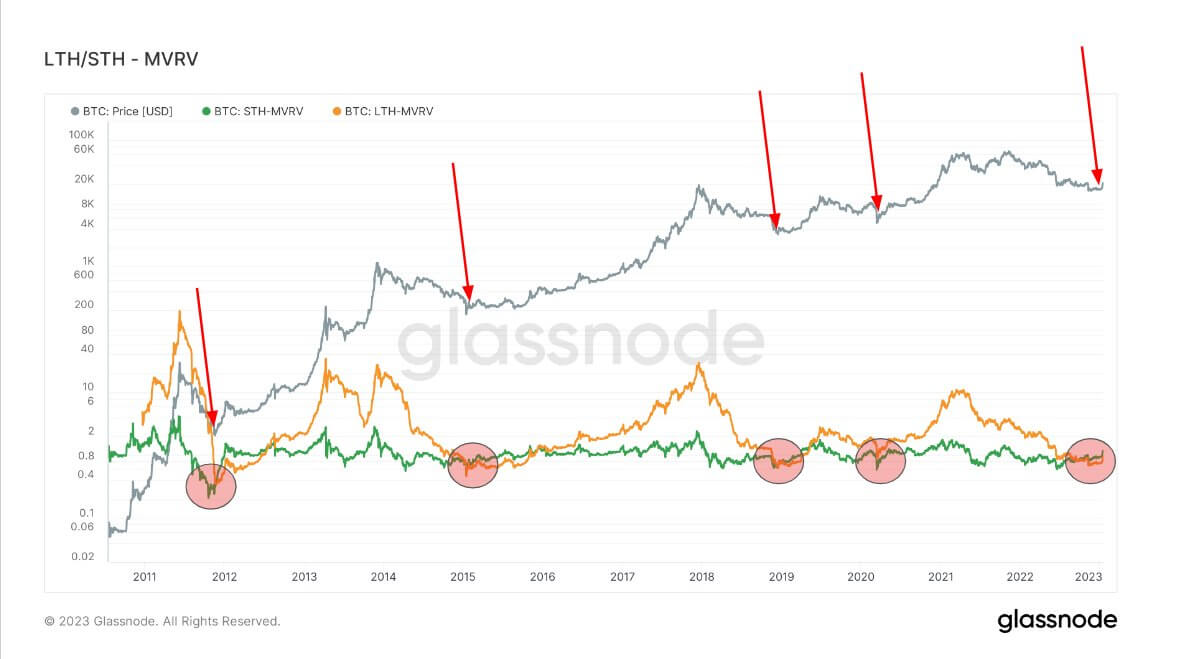
The MVRV ratio is a metric used to measure network valuation through its realized cap. Unlike market cap, realized cap approximates the value paid for all coins the last time they were moved. The MVRV ratio can be applied to coins belonging to long-term holders (LTHs) and short-term holders (STHs) to provide a better picture of how hodlers behave.
When the LTH MVRV ratio drops below the STH MVRV ratio, the market forms a bottom. Data from Glassnode shows the two bands converge in November.
Every time the ratios diverged, the market entered a recovery phase that led to a bull run.
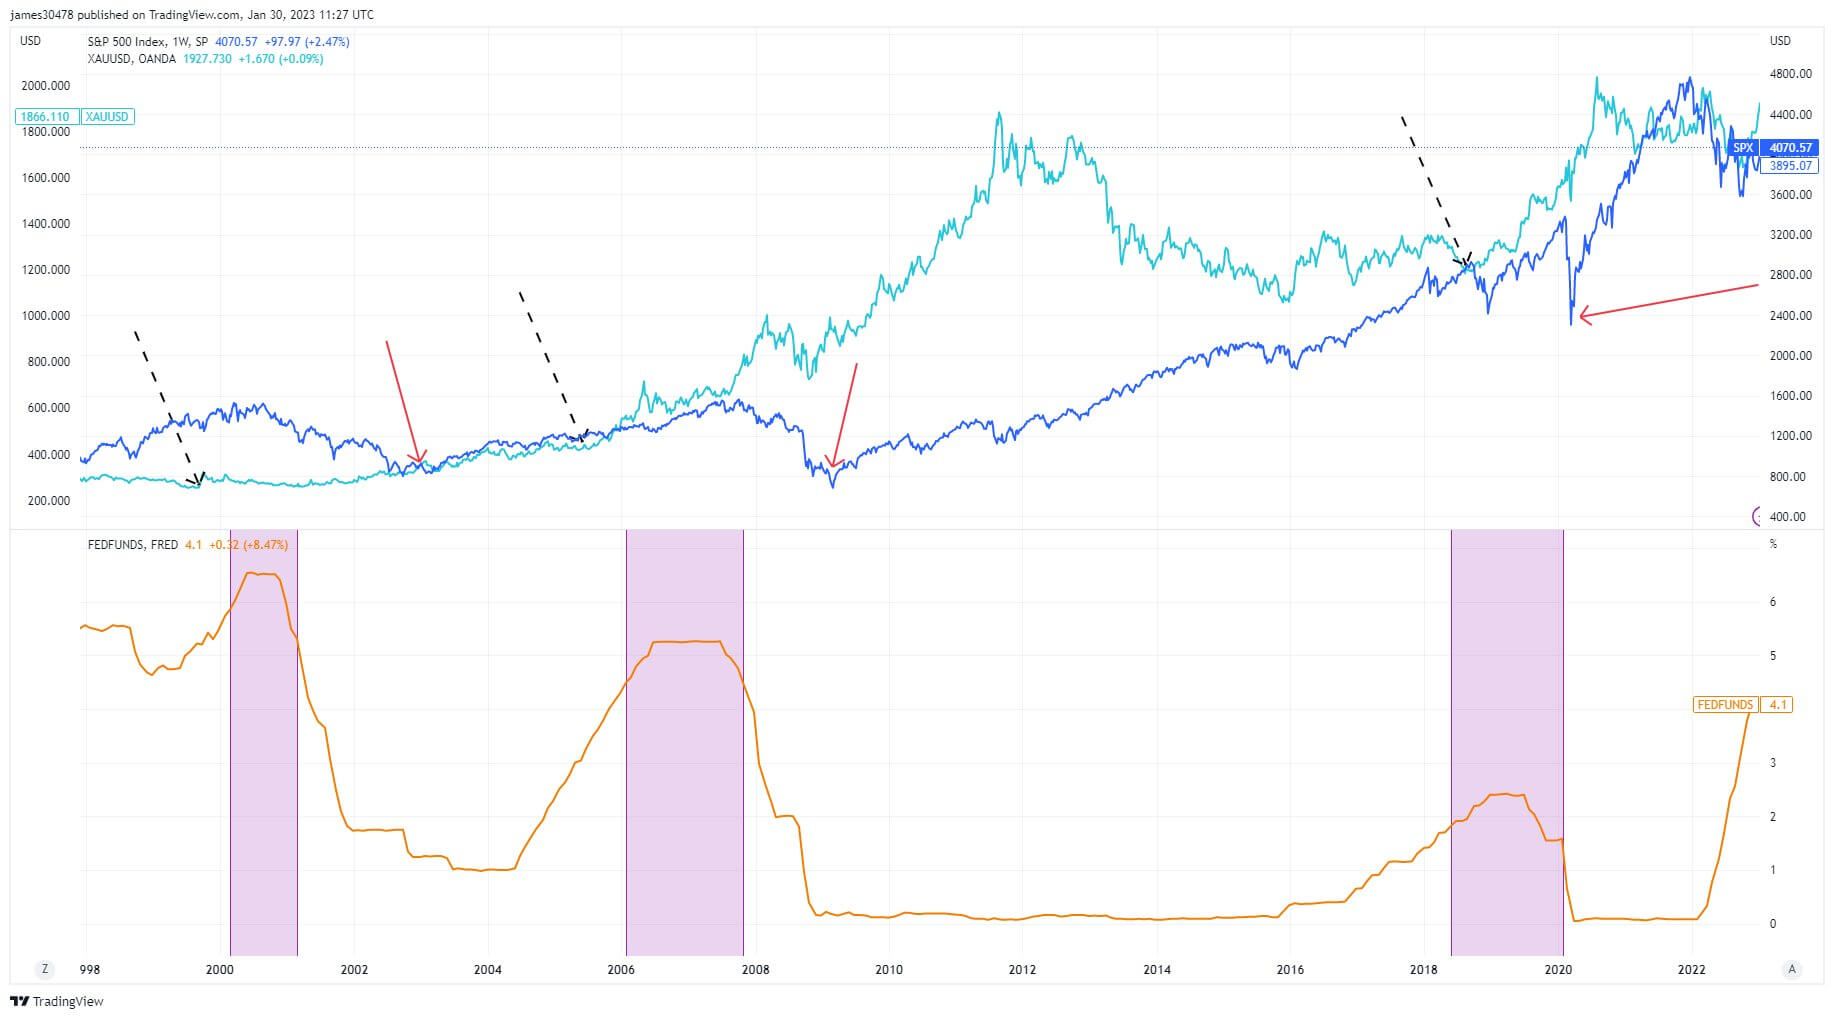
The Fed is pausing interest rate hikes
Since 1998, the top of the Federal Reserve’s rate hiking schedule correlated with the bottom in gold prices. The chart below marks the bottoms with black arrows.
Each of these bottoms was followed by an increase in the price of gold — after a drop to $400/oz in 2005, gold rose to $1,920/oz in just over six years.
While Bitcoin has long been compared to gold, it wasn’t until 2022 that they began showing a significant correlation. As of February, the price of Bitcoin and gold has shown an 83% correlation.
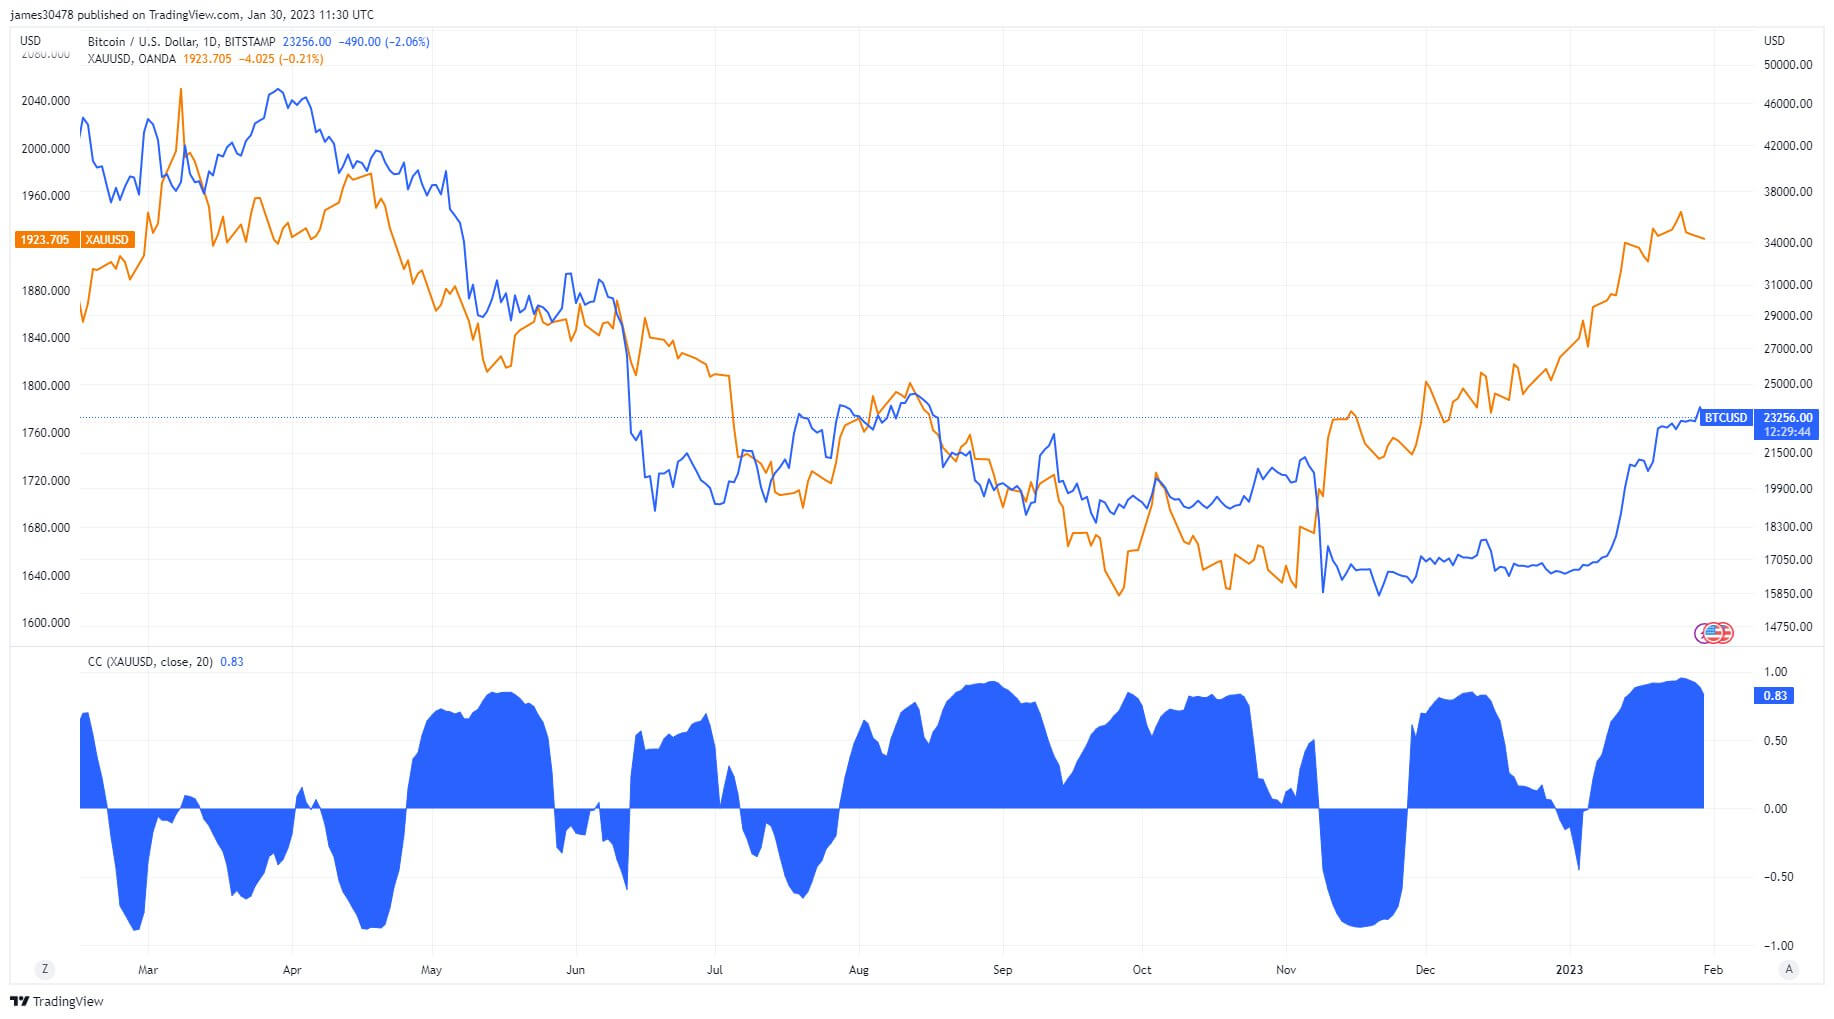
If gold repeats its historical reactions to interest rate hikes, its price could continue increasing well into the spring. An 83% correlation could also see Bitcoin’s price increase in the coming months and suggests a bottom has already been formed.
Why the market hasn’t bottomed – Uncertainty around narratives
The collapse of Terra (LUNA) in June 2022 triggered a chain of events that shook investor confidence in the market. The subsequent bankruptcy of other large industry players like Three Arrows Capital (3AC) and Celsius revealed the over-leveraged nature of the crypto market. It showed just how dangerous this corporatization was.
While some believe this culminated with the demise of FTX in November 2022, many are still worried that the chain reaction to its collapse could continue well into 2023. This led to the market questioning the integrity of Binance, Tether, and Grayscale and wondering whether DCG, a fund invested in almost every corner of the market, could be the next to fall.
Bitcoin’s climb to $23,000 failed to put these worries to rest. The fallout from FTX is yet to be felt in the regulatory space, with many industry players expecting tighter regulation at best. A market weakened with uncertainty is prone to volatility and could just as quickly see another bottom forming.
The volatility of the U.S. dollar
The purchasing price of the U.S. dollar has been consistently eroding for the past 100 years. Any attempts to keep the money supply in check were thrown out the window during the COVID-19 pandemic when the Federal Reserve embarked on an unprecedented money-printing spree. Around 40% of all the U.S. dollars in circulation were printed in 2020.
The DXY has gone deflationary regarding M2 money supply, causing significant volatility across other fiat currency markets. An unpredictable fiat currency makes it hard to denominate Bitcoin’s price and confirm a bottom.
Unstable fiat currencies have historically caused unnatural volatility in the price of hard assets and commodities.
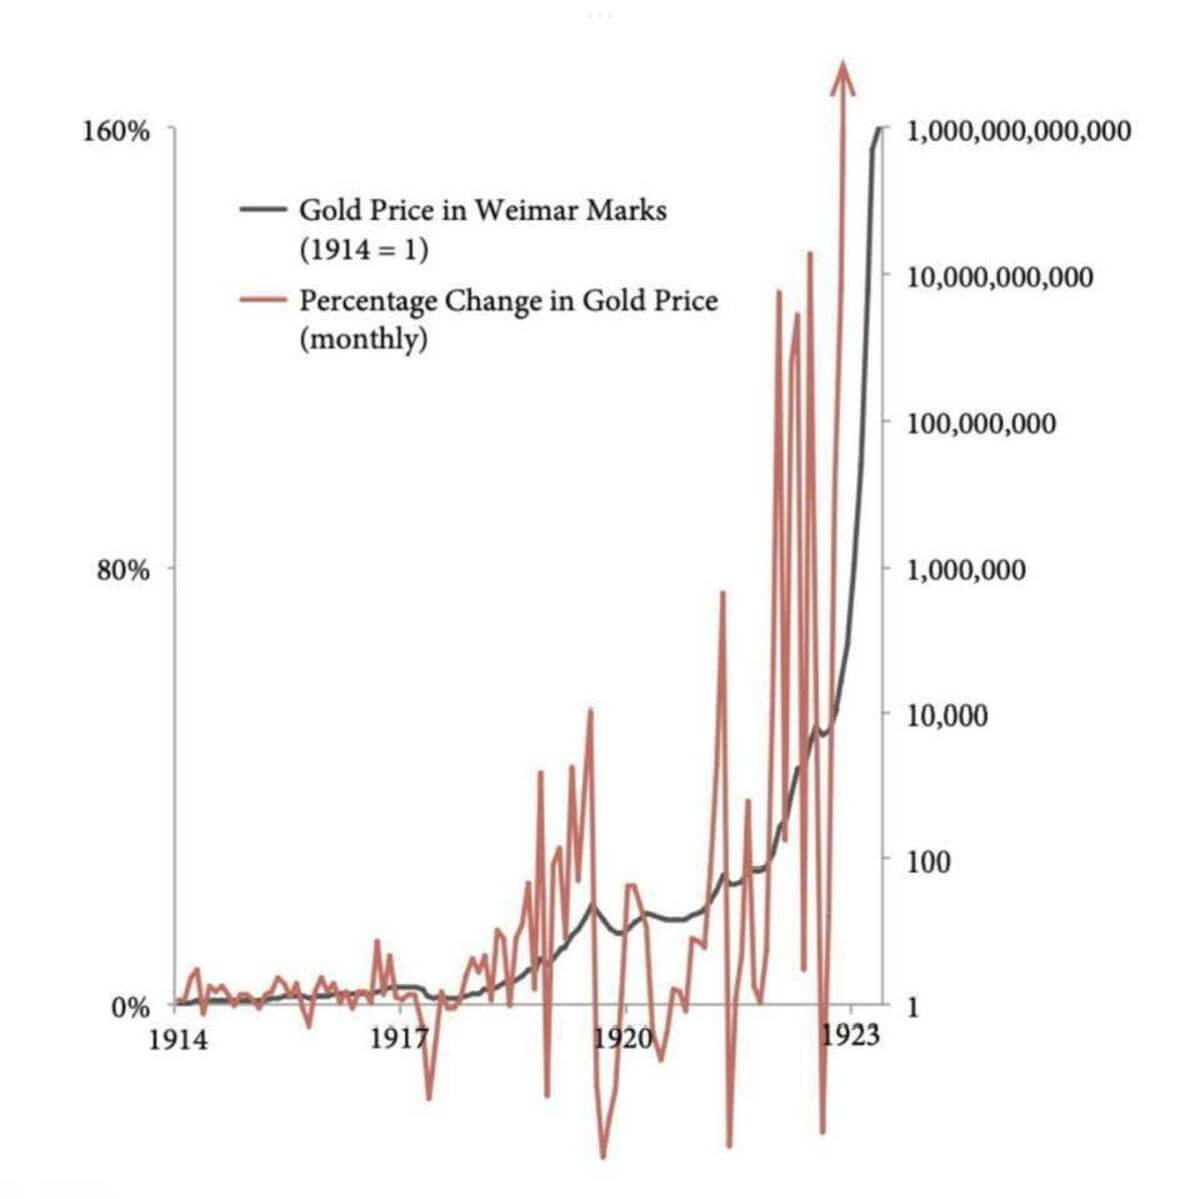
Following World War I, the Weimar Republic struggled with hyperinflation that rendered its Papiermark worthless. This led to a significant increase in the price of gold, as people rushed to put the rapidly devaluing fiat currency into a more stable asset.
However, while the overall price of gold increased from 1917 to 1923, its value in Papiermarks experienced unprecedented volatility. The fiat price for gold would increase as much as 150% and drop as much as 40% MoM. The volatility wasn’t in the purchasing price of the gold but in the purchasing power of the Papiermark.
And while the U.S. and other large economies are far from this type of hyperinflation, the volatility in fiat currencies could have the same effect on the price of Bitcoin.
- SEO Powered Content & PR Distribution. Get Amplified Today.
- Platoblockchain. Web3 Metaverse Intelligence. Knowledge Amplified. Access Here.
- Source: https://cryptoslate.com/market-reports/is-the-crypto-bottom-in-on-chain-says-yes-macro-says-pain-occurs-after-the-fed-pause/

