The latest assessment of the climate system paints a stark picture of how human activity has led to unprecedented changes across the climate system.
A report on the science of climate change by the Intergovernmental Panel on Climate Change (IPCC) in 2021 detailed the “unequivocal” role of humans and concludes that stopping further warming would require “substantial and sustained“ reductions in greenhouse gas emissions.
But while IPCC reports provide vital and authoritative evidence on climate change to policymakers and governments, the huge time and effort that goes into them means that they are only updated every 5-10 years.
This leaves a critical information gap.
We are a group of climate scientists from across 17 countries, all of us closely involved in the latest IPCC report cycle.
In our new analysis, we take a set of key ‘indicators’ of the climate system and update them with information available since the IPCC report in 2021.
Our indicators show how, since the IPCC’s climate report was published, human influence on the climate has continued apace, with greenhouse gas emissions at an all-time high.
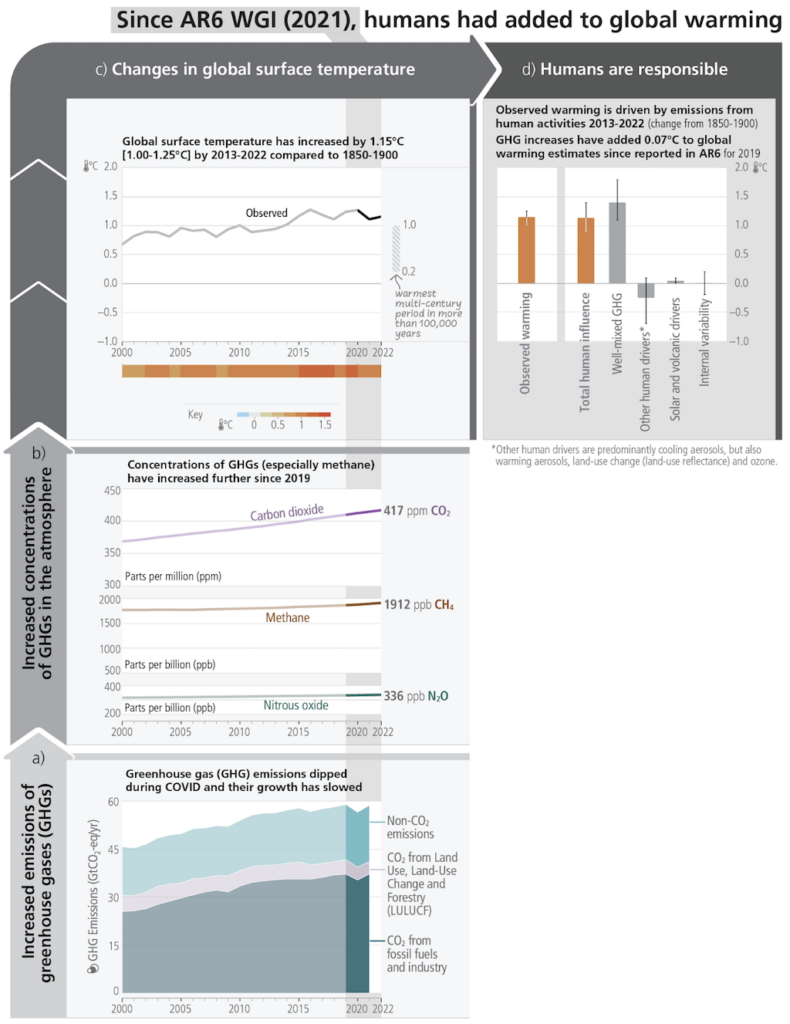
Human-caused warming is now at 1.14C, an increase of 0.07C since the 2021 IPCC report.
The remaining “carbon budget” for a good chance (50%) of staying within 1.5C has reduced by half compared to the estimate in the 2021 IPCC report, but is subject to uncertainty.
The rate at which emissions are increasing is falling, however. Depending on choices made in the near future, annual updates to these indicators could begin to track a change in direction for human influence on the climate.
Tracking climate change
The starting point for our new Indicators of Global Climate Change (IGCC) initiative is the latest data on greenhouse gas emissions, which have continued to build up in the atmosphere since the IPCC’s Sixth Assessment Report (AR6) on climate science in 2021.
The aim of the project is to provide a user–friendly means of tracking and understanding climate change and its progression, in a way that is consistent with the IPCC’s methods. This is important to ensure continuity between the IPCC’s major reports.
We trace a pathway through the climate system, closely following the approaches and methods used by the IPCC. This is the first time outside IPCC reports that all the necessary ingredients have been brought together to provide an assessment of human-caused warming.
What’s changed since AR6?
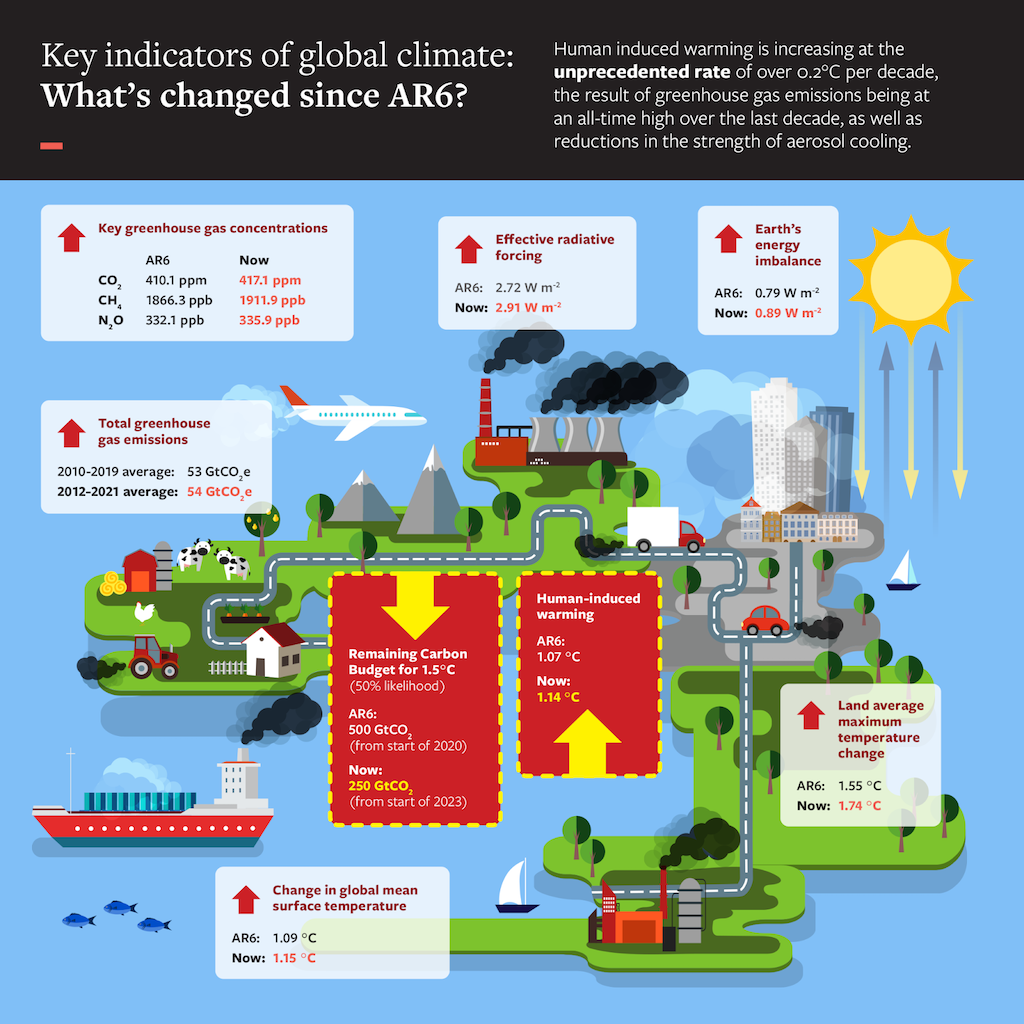
Since the last IPCC assessment of the climate system was published in 2021, greenhouse gas emissions have reached an all–time high of 54bn tonnes of CO2 equivalent (GtCO2e) per year. Human–caused warming is now at 1.14C, an increase of 0.07C.
The unprecedented rate of temperature rise (more than 0.2C per decade) further emphasises how we are still heading in the wrong direction. With climate change impacts and risks already becoming increasingly complex and difficult to manage, every fraction of a degree matters. This pace of change may mean that many natural and human systems will struggle to adapt.
We also intend to track extremes in temperature. In this first report, we track the maximum temperature over land and find it is rising twice as fast as the global average, and is now 1.74C above its preindustrial level.
At the same time, the remaining carbon budget for a 50% chance of staying below 1.5C has reduced by half, to around 250bn tonnes of CO2 (GtCO2). This is a result of continued emissions and updated estimates of human-caused warming, meaning the remaining budget for 1.5C is increasingly small and very uncertain.
| Climate indicator | IPCC Sixth Assessment Report (AR6) | Latest value |
|---|---|---|
| Greenhouse gas emissions (decadal average) | 53 GtCO2e (2010-2019) | 54 Gt CO2e (2012-2021) |
| Human–induced warming since preindustrial times (decadal average) | 1.07C (2010-2019) | 1.14C (2012-2021) |
| Remaining carbon budget (1.5C, 50% chance) | 500 GtCO2 | About 250 GtCO2 and very uncertain |
As well as these headline indicators, our analysis updates estimates of atmospheric greenhouse gas concentrations, effective radiative forcing, the Earth’s energy imbalance, and global mean temperature change, all of which are important indicators of the state of the climate system in their own right.
Visualising the data
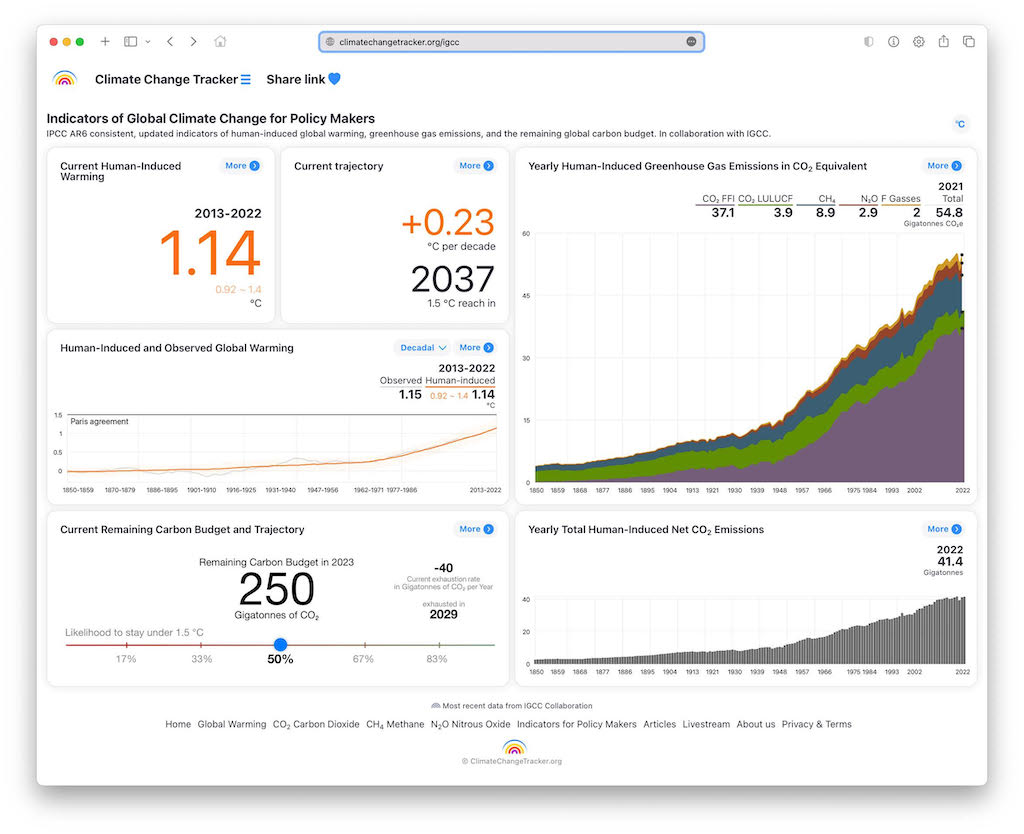
To make the data more accessible and user-friendly, IGCC has developed a “dashboard” of climate indicators.
For now, the dashboard focuses on the main policy-relevant indicators: greenhouse gas emissions; human–caused global warming; the rate of temperature change; and the remaining global carbon budget.
Users will be able to track changes in the climate system (as the data becomes available), see trends in the indicators, “roll over” the data to see specific values for data points, and embed the charts in their own websites.
Although the dashboard is primarily aimed at policymakers, the ultimate intention is to reach and inform a much wider audience. For example, through developing targeted briefings specific to regional considerations and case studies for how the dashboard and information can be used.
Reality check
There is an urgent need for strong and decisive climate action that is based on reliable and up–to–date scientific evidence. By providing yearly updates of these indicators, we hope to support decision–makers in the periods between IPCC reports, providing them with easy to find, easily understandable climate information.
Annual updates to these indicators produced by a wide global community will also help to increase transparency and trust. They can also help explain changes between IPCC reports, for example, as the science advances or any methodologies are updated.
As discussions at the UNFCCC’s Bonn Climate Change Conference continue in preparation for COP28 later this year, the IGCC team is keen to expand the set of climate indicators, guided by what policymakers from different countries would find most useful.
For example, this first analysis includes an update of maximum temperatures over land, which are rising at a substantially faster rate than global average mean temperatures. More information on climate and weather extremes could further demonstrate how rapid climate change is manifesting on the ground.
The ultimate aim is for IGCC to become the go–to place for robust and IPCC–consistent updates on the state of the climate system and how it is changing as a result of human activity. And, as time passes, IGCC can provide a strong science “reality check” on our collective progress, or otherwise, in tackling climate change.
Forster, P. M. et al. (2023) Indicators of Global Climate Change 2022: Annual update of large-scale indicators of the state of the climate system and the human influence, Earth System Science Data, doi.org/10.5194/essd-2023-166
- SEO Powered Content & PR Distribution. Get Amplified Today.
- EVM Finance. Unified Interface for Decentralized Finance. Access Here.
- Quantum Media Group. IR/PR Amplified. Access Here.
- PlatoAiStream. Web3 Data Intelligence. Knowledge Amplified. Access Here.
- Source: https://www.carbonbrief.org/guest-post-new-indicators-will-track-climate-change-between-ipcc-reports/

