
Published 4 hours ago
The Bitcoin price has been rising within ascending channel pattern for over two weeks. However, in theory, this pattern is bearish and encourages significant downfall upon the breakdown of its support trendline. Though this technical setup calls for a temporary correction, the overall trend of Bitcoin
advertisement
Key Points:
- The formation of a rising channel pattern hints at a temporary correction in the Bitcoin price
- A golden crossover between the 50-day and 200-day MAs indicates a long-term bullish rally
- The intraday trading volume in Bitcoin is $15.5 Billion, indicating a 32% loss
History Of Bitcoin’s Golden Crossover
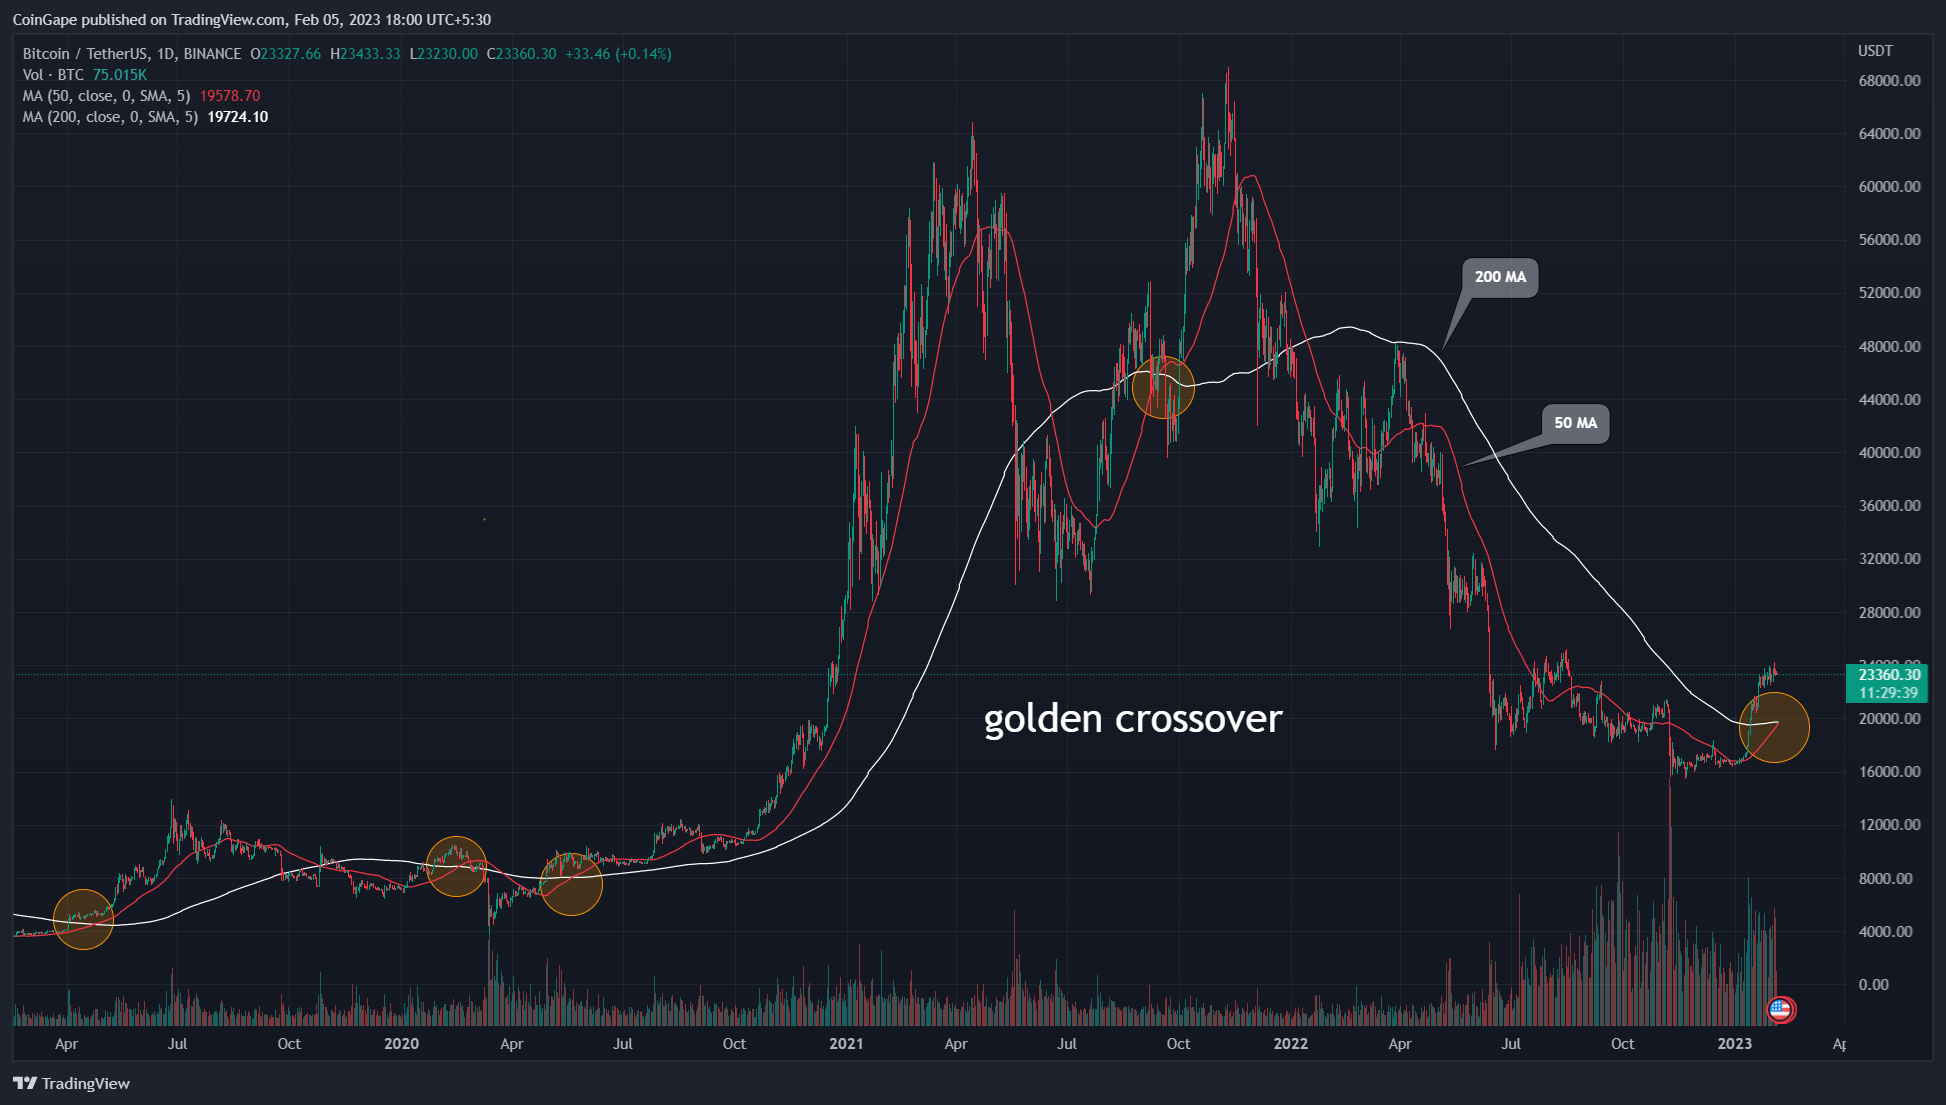
Source-tradingview
A golden crossover occurs when a technical indicator of 50 MA(moving average) slope moves above 200 MA. This event is interpreted as a bullish signal by many traders, suggesting that the trend has changed and the coin is likely to move higher.
Previously, the golden crossover in Bitcoin price was observed on 14th September 2021, after which the prices reached 50% higher and hit All time high of $68,789.
Trending Stories
Before that, the golden crossover occurred on 20th May 2020, which, along with the bull trend, carried the Bitcoin price 700% higher to reach the $64758 top. However, on 18th Feb 2020, the daily chart showed the same crossover but failed to trigger a significant rally.
Furthermore, a golden crossover on 20th April 2019 surged the BTC price 162% higher to hit a high of $13963 in just two months.
Back to the present, the daily chart shows the 50-and-200-day MAs are on the verge of golden crossover again, increasing the likelihood of uptrend continuation. If Bitcoin sustains this crossover, the coin holders may enjoy a strong uptrend until they receive their first threat of price breakdown below the 50-day MA.
Also Read: Top 10 DeFi Lending Platforms In 2023
Bitcoin Price Analysis
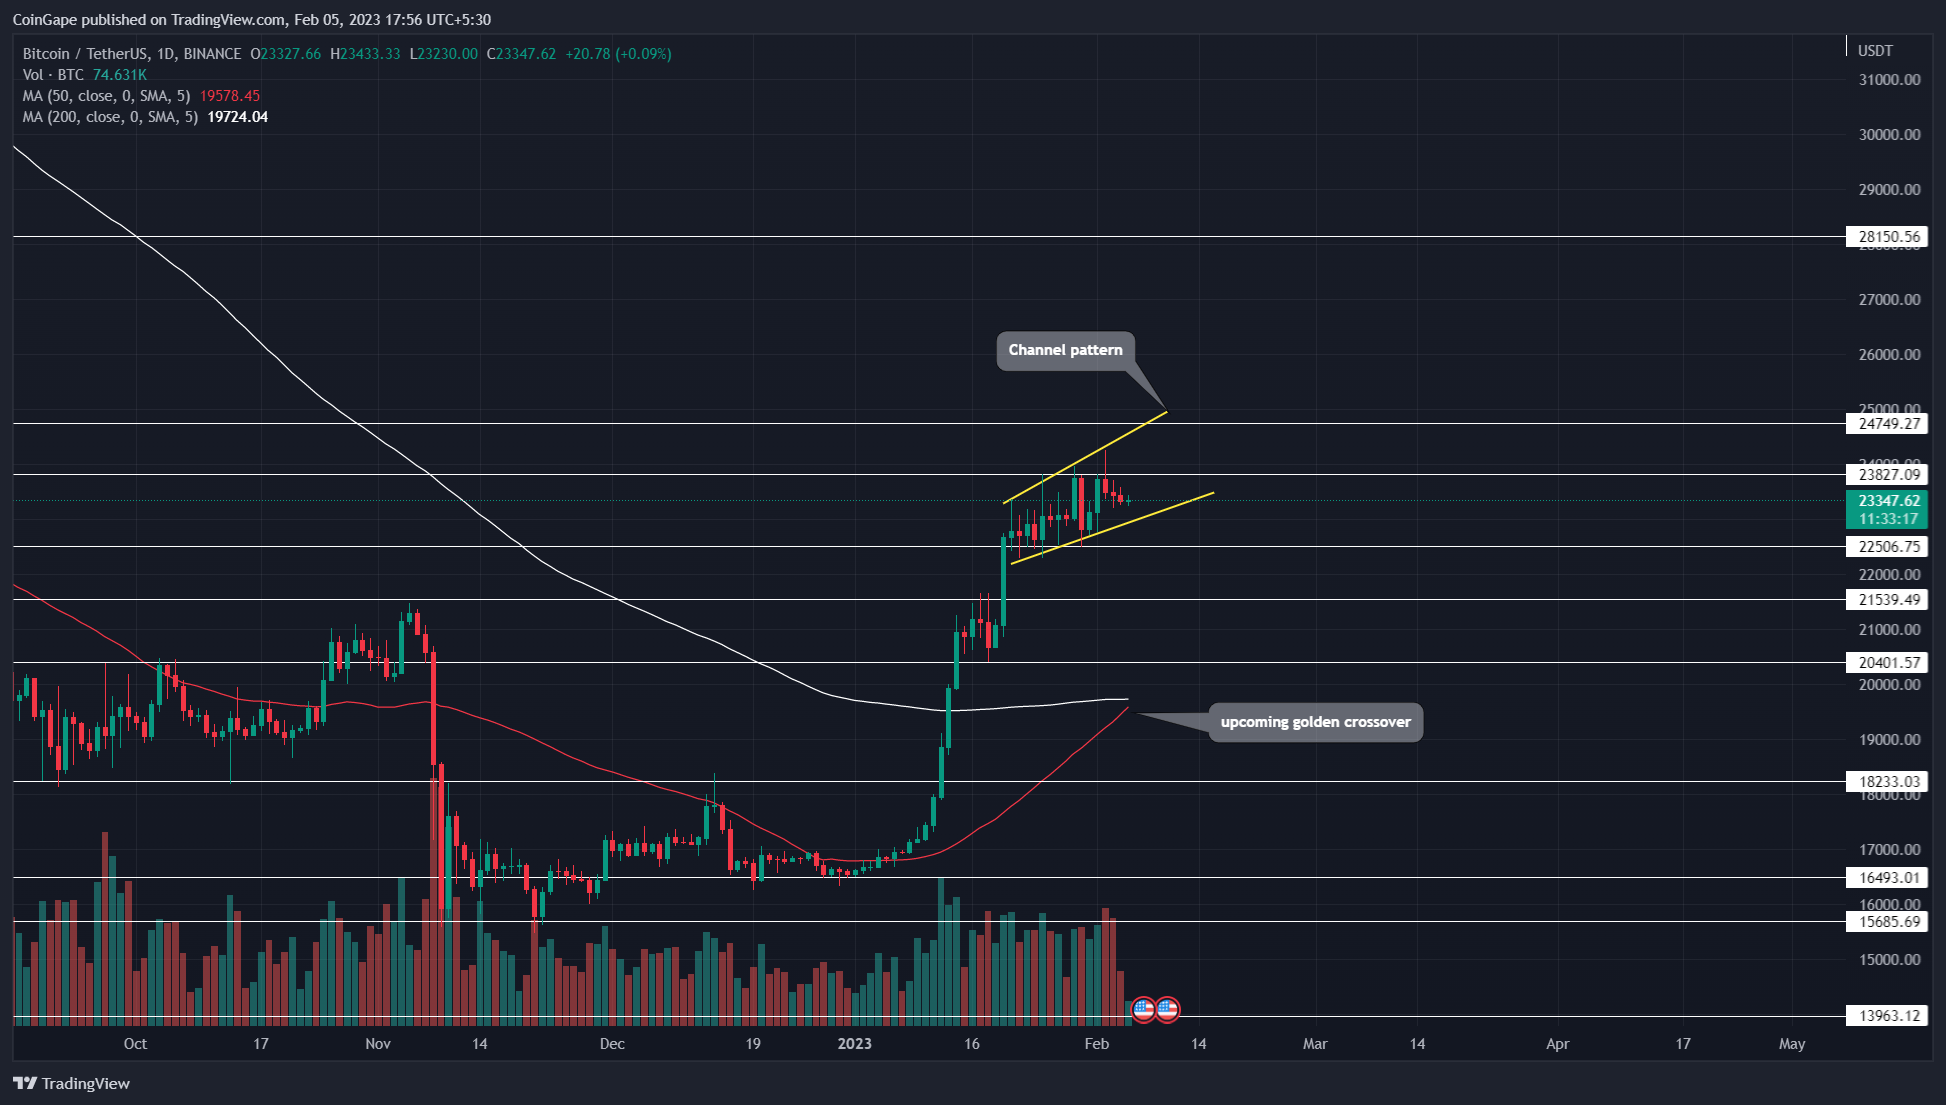
Source-Tradingview
By the press time, the Bitcoin price trades at $23388 and continues to resonate within the rising wedge pattern. However, if the selling pressure persists, the coin price will plunge lower and challenge the support trendline of the pattern.
A daily candle closing below the trendline will accelerate the selling pressure and poise Bitcoin for a longer correction. This downfall could tumble the Bitcoin price 8-12.5% to revisit the $21500 or $20400 support.
advertisement
Anyhow, this bearish pullback is essential for coin holders as it will neutralize the excess buying and replenish bullish momentum. If the coin price shows sustainability above the aforementioned support, the sided-lined buyers could grab a pullback opportunity.
Bitcoin Price Intraday Levels
- Spot rate: $23348
- Trend: Bullish
- Volatility: High
- Resistance levels- $25000 and $28000
- Support levels- $22500 and $21500
Share this article on:
The presented content may include the personal opinion of the author and is subject to market condition. Do your market research before investing in cryptocurrencies. The author or the publication does not hold any responsibility for your personal financial loss.
- SEO Powered Content & PR Distribution. Get Amplified Today.
- Platoblockchain. Web3 Metaverse Intelligence. Knowledge Amplified. Access Here.
- Source: https://coingape.com/markets/first-golden-crossover-of-2023-sets-bitcoin-price-to-cross-above-40000/

