
Published 7 hours ago
Ethereum Price Analysis: The Ethereum price has been falling over the past four months under the inference of a parallel channel pattern. In theory, this pattern itself resembles an established downtrend but provides a direction bullish rally upon the breakout of its resistance trendline. Here’s how this pattern may influence ETH’s future price.
advertisement
Key points:
- A parallel channel pattern governs the ongoing downfall
- The $1230 breakout will resume the prior recovery rally and set ETH for a 12% jump
- The intraday trading volume in Ether is $4.45 Billion, indicating a 39% loss
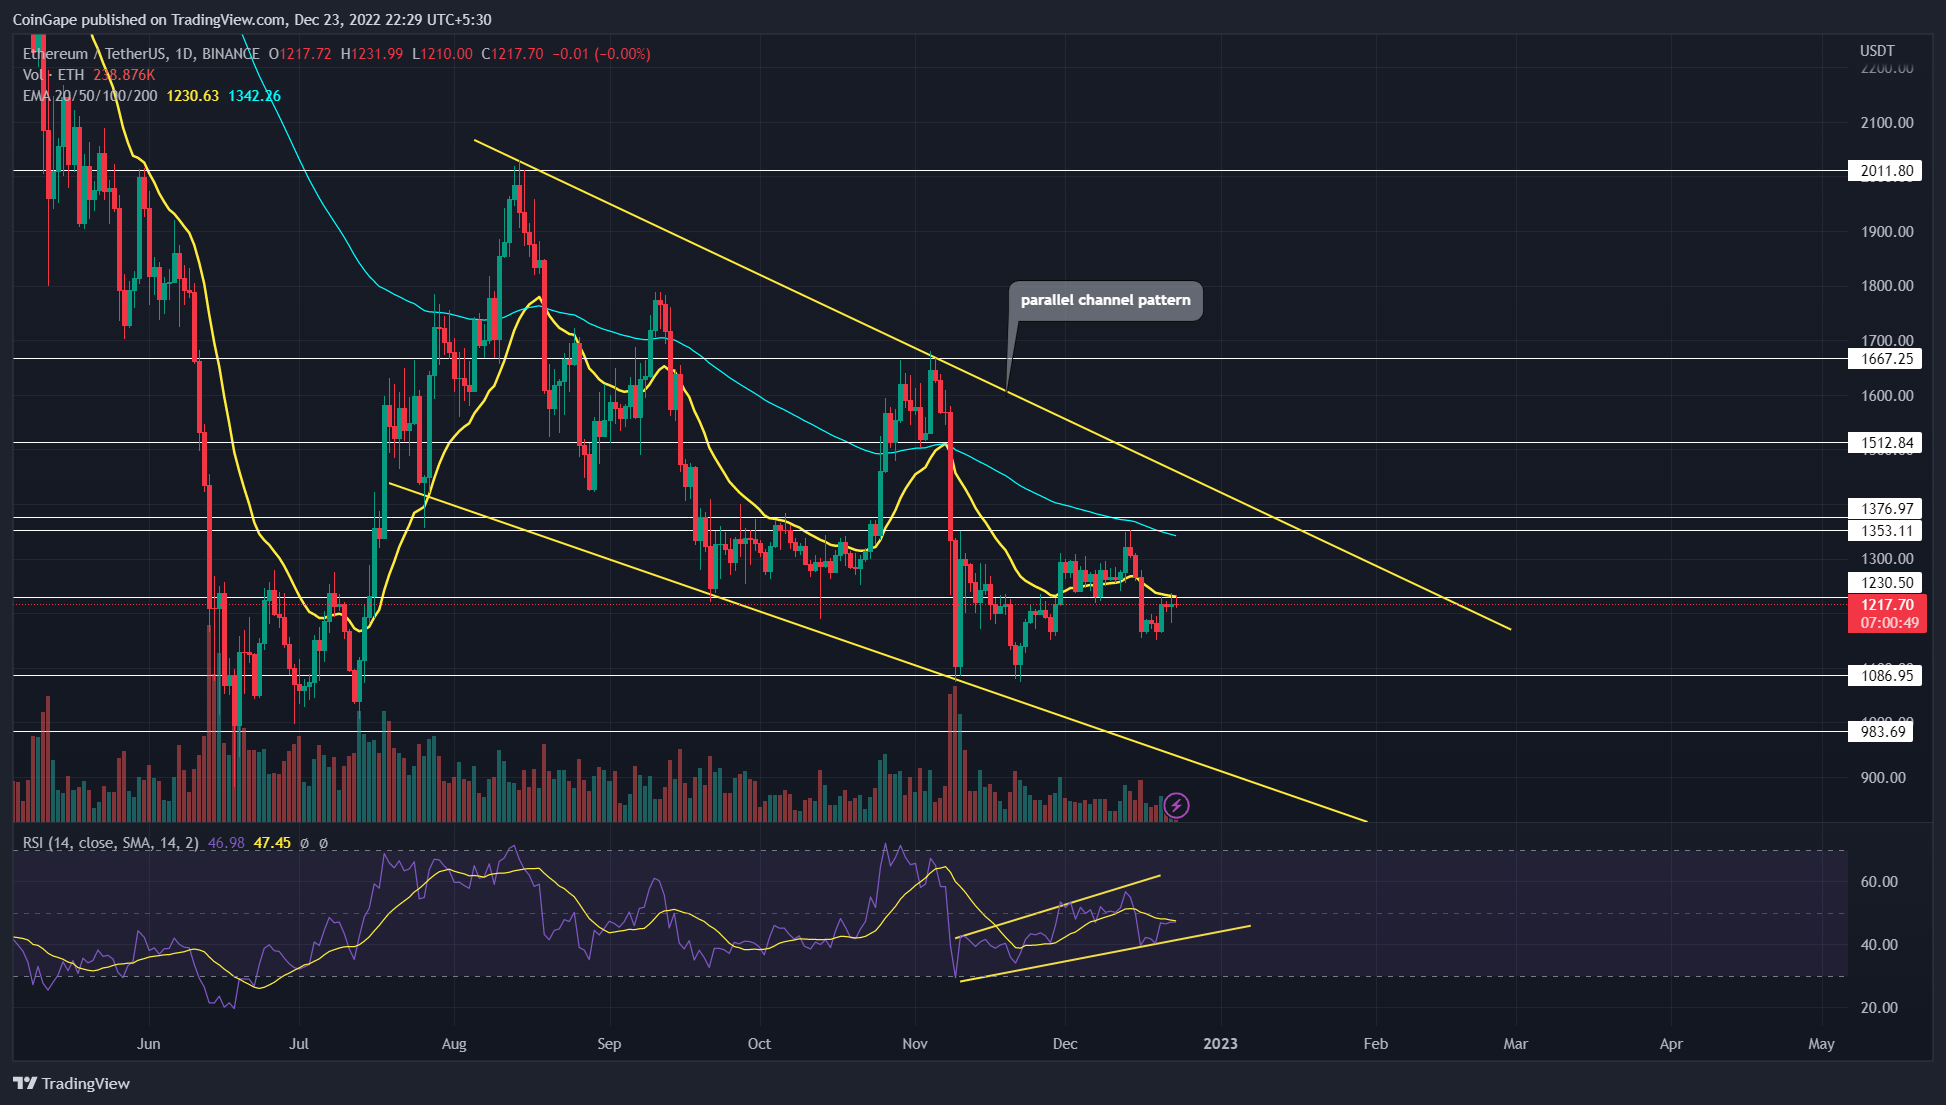
Source- Tradingview
On November 10th, the Ethereum price rebounded from the pattern support trendline and triggered a new bull cycle. However, this new recovery face could never surpass the $1350 barrier as the crypto market witnessed sudden selling pressure in mid-December.
The recent sell-off was triggered by the FUD surrounding Binance, the largest exchange by volume. Therefore the ETH price tumbled 13% from the mentioned resistance and breached local support of dollar 1230.
Trending Stories
Amid ongoing uncertainty in the crypto market, the Ethereum price is trying to sustain below the breached support. If the selling pressure persists, the ETH price will tumble 20% down to revisit the $1000 or $980 support.
On a contrary note, if the last downfall was mainly due to panic selling, a daily candle closing above $1230 resistance will hint at the resumption of the prior bull cycle.
Furthermore, a potential bullish breakout from the overhead trendline will signal an early sign of price recovery. If the market sentiment supports buyers, an ideal target from this pattern will push the prices to $1500.
Technical Indicator
RSI: While the Ethereum price walks sideways in a short-term trend, the daily RSI slope rising indicates growth in bullish momentum. Thus, this bullish divergence indicates a higher possibility for prices to revisit the $1350 level.
advertisement
EMA’s: the downsloping EMAs(20, 50, 100, and 200) offer additional resistance to stall the potential price rally.
Ethereum Coin Price Intraday Levels-
- Spot rate: $1219
- Trend: Bullish
- Volatility: High
- Resistance level- $1230 and $1300
- Support level- $1150 and $1080
Share this article on:
The presented content may include the personal opinion of the author and is subject to market condition. Do your market research before investing in cryptocurrencies. The author or the publication does not hold any responsibility for your personal financial loss.
- SEO Powered Content & PR Distribution. Get Amplified Today.
- Platoblockchain. Web3 Metaverse Intelligence. Knowledge Amplified. Access Here.
- Source: https://coingape.com/markets/ethereum-price-analysis-eth-sees-12-jump-to-revisit-1375-mark/

