Data Analysis Using Scala
It is very important to choose the right tool for data analysis. On the Kaggle forums, where international Data Science competitions are held, people often ask which tool is better. R and Python are at the top of the list. In this article we will tell you about an alternative stack of data analysis technologies, based on Scala.
By Roman Zykov, Founder/Data Scientist @ TopDataLab

It is very important to choose the right tool for data analysis. On the Kaggle.com forums, where international Data Science competitions are held, people often ask which tool is better. R and Python are at the top of the list. In this article we will tell you about an alternative stack of data analysis technologies, based on Scala programming language and Spark distributed computing platform.
How did we come up with it? At Retail Rocket we do a lot of machine learning on very large data sets. We used to use a bunch of IPython + Pyhs2 (hive driver for Python) + Pandas + Sklearn to develop prototypes. At the end of summer 2014 we made a fundamental decision to switch to Spark, as experiments have shown that we will get 3-4 times the performance improvement on the same park of servers.
Another advantage is that we can use one programming language for modeling and code that will run on production servers. This was a huge benefit for us, since before we were using 4 languages simultaneously: Hive, Pig, Java, Python. It’s a problem for a small team of engineers.
Spark supports working with Python/Scala/Java through APIs well. We decided to choose Scala because it is the language Spark is written in, which means that we can analyze its source code and fix bugs if needed. It is also the JVM on which the Hadoop runs.
I must say that the choice was not easy, since no one in the team knew Scala at the time.
It is a well-known fact that to learn to communicate well in a language, you need to immerse yourself in the language and use it as much as possible. So we abandoned the Python stack in favor of Scala for modeling and fast data analysis.
The first step was to find a replacement for IPython notebooks. The options were as follows:
- Zeppelin – an IPython-like notebook for Spark;
- ISpark;
- Spark Notebook;
- IBM’s Spark IPython Notebook.
- Apache Toree
So far the choice has been ISpark because it’s simple – it’s IPython for Scala/Spark. It’s been relatively easy to bolt on HighCharts and R graphics. And we had no problem connecting it to the Yarn cluster.
Task
Let’s try to answer the question: does average purchase amount (AOV) in your online store depend on static customer parameters, which include settlement, browser type (mobile/Desktop), operating system and browser version? You can do this with Mutual Information.
We use entropy a lot for our recommendation algorithms and analysis: the classical Shannon formula, the Kullback-Leibler divergence, Mutual Information. We even submitted a paper on this topic. There is a separate, albeit small, section devoted to these measures in Murphy’s famous textbook on machine learning.
Let’s analyze it on real Retail Rocket data. Beforehand I copied the sample from our cluster to my computer as a csv file.
Data
Here we use ISpark and Spark running in local mode, which means that all calculations are performed locally and are distributed among the processor cores. Everything is described in comments to the code. The most important thing is that in output we get RDD (Spark data structure), which is a collection of case classes of type Row, which is defined in the code. This will allow you to refer to fields via “.”, for example _.categoryId.


The line above uses the new DataFrame data type added to Spark in version 1.3.0, it is very similar to the similar structure in the pandas library in Python. toDf picks up our Row case class, so we can refer to the field by name.
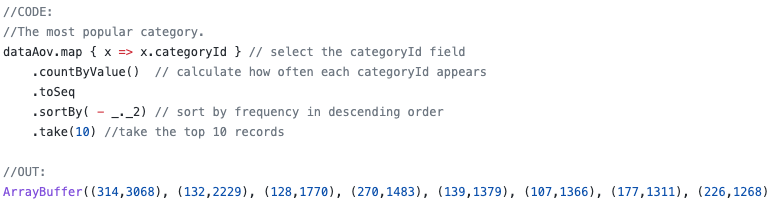
For further analysis, we need to select a single category, preferably with a lot of data. To do this, we need to get a list of the most popular categories.

Theoretically, you can use any HighCharts graphs as long as they are supported in Wisp. All charts are interactive.
Let’s try to do the same thing, but with R.
Run the R client and plot a char:


Mutual Information
The graphs show that there is a relationship, but will the metrics confirm this conclusion for us? There are many ways to do this. In our case, we use Mutual Information between the values in the table. It measures the mutual dependence between distributions of two random (discrete) variables.
For discrete distributions, it is calculated using the formula:

But we are interested in a more practical metric – the Maximal Information Coefficient (MIC) which requires some tricky calculations for continuous variables. Here is how the definition of this parameter sounds.
Let D = (x, y) be a set of n ordered pairs of elements of random variables X and Y. This two-dimensional space is partitioned by X and Y grids, grouping x and y values into X and Y partitions, respectively (remember histograms!).

where B(n) is the mesh size, I∗(D, X, Y ) is the mutual information of the X and Y partitions. The denominator specifies the logarithm, which serves to normalize the MIC to the values of the segment [0, 1]. MIC takes continuous values in the interval [0,1]: for extreme values it is 1 if there is a dependence, 0 if there is not. What else can be read on this topic is listed at the end of the article, in the list of references.
The book (Machine Learning: a Probabilistic Perspective) calls MIC (mutual information) a 21st century correlation. And here’s why! The graph below shows 6 dependencies (C to H graphs). Pearson’s correlation and MIC have been calculated for them, and they are marked with the corresponding letters on the chart to the left. As we can see, the Pearson correlation is almost zero, while the MIC shows a correlation (graphs F, G, E).
 Source: Reshef, D. N., Y. A. Reshef, H. K. Finucane, S. R. Grossman, G. McVean, P. J. Turnbaugh, E. S. Lander, M. Mitzenmacher, and P. C. Sabeti. “Detecting Novel Associations in Large Data Sets.”
The table below shows a number of metrics that have been calculated on different dependencies: random, linear, cubic, etc. The table shows that the MIC behaves very well, detecting nonlinear dependencies.
 Source: Reshef, D. N., Y. A. Reshef, H. K. Finucane, S. R. Grossman, G. McVean, P. J. Turnbaugh, E. S. Lander, M. Mitzenmacher, and P. C. Sabeti. “Detecting Novel Associations in Large Data Sets.”
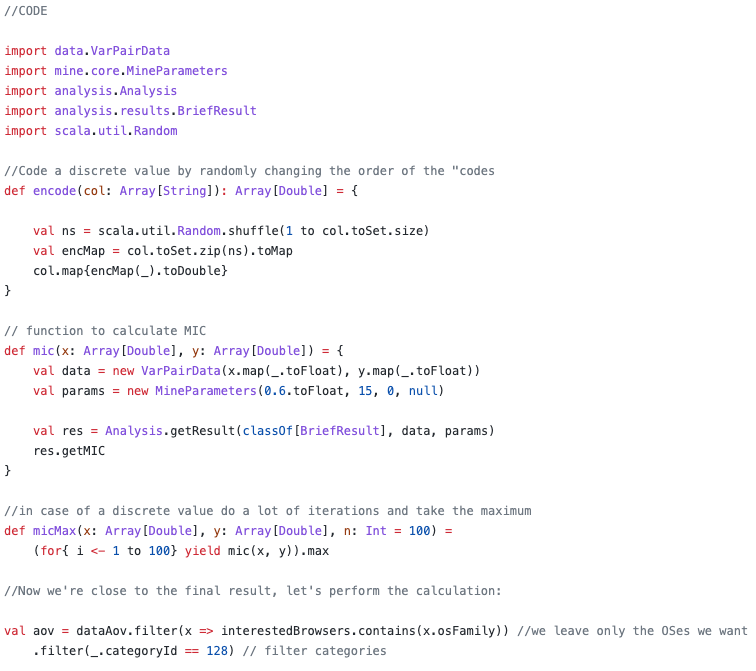
In our case, we are dealing with a MIC calculation where we have a continuous variable Aov and all others are discrete with unordered values, such as browser type. In order to calculate the MIC correctly we need to discretize the Aov variable. We will use a ready-made solution from exploredata.net. There is one problem with this solution: it assumes that both variables are continuous and expressed in Float values. So we’ll have to trick the code by encoding the values of the discrete variables into Float and randomly changing the order of these variables. To do this, we will have to do many iterations with random order (100), and we will take the maximum MIC value as the result.


For the experiment, I added a random variable with a uniform distribution and the AOV (Average Purchase Value) itself. As we can see, almost all MIC was below the random MIC, which can be considered a “conditional” decision threshold. The Aov MIC is almost unity, which is natural, because the correlation to itself equals 1.
An interesting question arises: why do we see a correlation on the graphs, but the MIC is zero? We can come up with a lot of hypotheses, but most likely for the case of os Family it is quite simple – the number of Windows machines is much higher than the number of others:

Conclusion
I hope that Scala will get its popularity among data analysts (Data Scientists). It is very convenient because it is possible to work with a standard IPython notebook + get all the features of Spark. This code can safely work with terabytes of data, you just need to change the configuration line in ISpark, specifying the URI of your cluster.
References
[1] Reshef, D. N., Y. A. Reshef, H. K. Finucane, S. R. Grossman, G. McVean, P. J. Turnbaugh, E. S. Lander, M. Mitzenmacher, and P. C. Sabeti. “Detecting Novel Associations in Large Data Sets.”
[2] MINE: Maximal Information Nonparametric Exploration software using MIC
[3] Minepy – Maximal Information-based Nonparam (Python, C++, MATLAB, Octave))etric Exploration.
[4] Java library with datasets for MIC
[5] “Machine Learning: a Probabilistic Perspective” Kevin Patrick Murphy
[6] Gist of the code above
Bio: Roman Zykov is Founder and Data Scientist at TopDataLab, and has 20 years of experience in data analysis, holding a master’s degree in applied mathematics and physics. Roman also wrote the book “Roman’s Data Science: How to monetize your data”, available on Amazon.
Original. Reposted with permission.
Related:
PlatoAi. Web3 Reimagined. Data Intelligence Amplified.
Click here to access.
Source: https://www.kdnuggets.com/2021/09/data-analysis-scala.html

