
Conviction level: High
Personal stake: Short positions in certain indexes and asset classes outlined on article below.
Expectations: Larger decline in SPY, defaults or liquidations of some financial institutions and credit market freeze. Broad scale economic recession or perhaps depression with minimum one year duration. No recovery of asset prices (stocks, RE, bonds etc) until the QE announcement from central banks somewhen in 2024 possibly. In my view, cutting of interest rates will not be enough to stimulate markets, therefore if rate cuts happen in later portion of this year (likely) it will still take several months more of downside and then QE introduction to turn things around. I could be wrong and this is just personal view, but that scenario and its timing based on functionality of historical crises and central bank reactions makes sense.
The positions posted are not financial advice or recommendations. The positions outlined are not meant as follow or copy signal, but rather to highlight where my focus is, and to put some credibility on the line that this is not just an academic opinion with no stake on the line.
Let’s break down, why we might be facing an economic slowdown, combined with credit freeze and potential eruption of defaults in the financial sector. Please make sure to read the article on “the 4th turning” as this goes hand in hand with why the recession/crisis is probably happening in the first place.
4th turnings impact and results so far:
-The geopolitical disruption (Russia, China)
-And decrease in global growth (slowdown in many global countries)
-Combined with trade dislocations (covid lockdowns)
-And the rise of global inflation (as result of everything above)
are the core reasons of why the economic recession should/might be happening in the first place. Therefore we cannot dislocate 4th turning as a cycle outside of what the projections of this article are in terms of the economy and financial markets for this year and the next half of 2024. In fact the 4th turning (and all 3 key factors outlined) is the core of why the economic crisis and slowdown might happen.

The dark clouds are gathering, and the winds ahead of the storm are increasing since mid of 2022. The storm is not here yet, but it seems like if a correlation to past “storms” is made over the 100 years, the patterns are clearly emerging in the broad economy but especially the financial sector, banking, real estate, and brokerage industry. Liquidity and demand is drying out, asset valuations are coming down and hence creating liquidity shortfalls or balance sheet under-capitalization issues.
Real estate prices coming down over past 12 months:
Inventories are on the rise across the US and some other markets, demand is cooling and high mortgage payment increases due to interest rates rises are decreasing demand for RE.

Unrealized losses on banks balance sheets:
The casues of which were falling bond prices, mortgage declines and other instruments as result of quickly rising interest rates (repricing the assets).

Besides that, there is much more to list, but this is a good start. Above matters, because undercapitalization of banks is a serious issue if unsolved fast (due to deposit flight), and the wealth effect decrease due to RE price declines, causing consumers across the board to cut on spending. Both of those effects create fear and increase the chances of a more serious recession. But let’s leave that aside for now.
A lot of inputs on the article are going to be personal conclusions but some data will be presented as objective, as reader make sure not to confuse the two. As author (with someone strong opinion on subject) I do stand by my conclusions as they have been carefully gathered and rethought many times over the past 2 years, and the counterarguments for the “non-event” situation have decreased to the point where in my view the situation will unfold in either of the three scenarios described on the article below, none of which should be positive for equity markets or a majority of asset prices for that matter.
A quick summary of personal view on upcoming recession since late 2020:
In 2021 the consequences of lockdowns and supply chain disruption were pointing toward economic impact in a negative sense. When one was tracking the development, it was hard to imagine not leaving a long-standing impact on the economy, the question was just in what manner it would manifest itself.
Perhaps drag on earnings, lesser savings as businesses incomes drop, savings decrease as many businesses are forcefully semi-shut down by lockdown restrictions or unable to function at full capacity, inflation increase due to congestion of shipping and ports, and many more valid reasons to establish already in 2021 before it all began in 2022.
As the situation was unfolding my view was that consequences of such actions should be seen in economic data prints, hence potentially opening the path for recession, but for the entire year since Q3 2020, the data did not respond, until…CPI indexes started to uptick consistently in late 2021.

So the first (obvious) data out of all to respond was perhaps inflation. One might think that an unemployment increase, slowdown in hires, or decrease in savings might be the rational data points to see an uptick but that did not happen. The central banks clouded the entire situation with excess liquidity which created this strange vortex of mixed and delayed outcomes. Altough it is true, that unemployment increase is generally the data that starts to increase the last, when recession is already well established.
After (Q1 of 2022) inflation increase and geopolitical strife of Ukraine in 2022, the monetary politics of central banks went into massive reversal using the context of the past 3 decades.
We saw significant monetary tightening with interest rates increasing quite a lot, but not just that, they increased very fast, which is even more important. For 3 decades the global financial system and economies have been enjoying very low interest rates with the majority of the time deflationary environment present. As much as this is helpful, it is also inviting a Torjan horse. Why? Because it creates over-valuations and bubbles, which if such monetary policies were to inverse after decades, it can create a lot of pain and turbolence in markets for years to come. This is the core issue of why we have seen crypto markets collapse, equities struggle, RE markets cooling down, asset price valuations were inflated over many years and now coming down at once. Including bonds, which out of all is perhaps the scariest.
The real danger of why we might see a truly deep economic crisis this time is that many asset classes have been heavily inflated over years, and have not seen major deflationary bust for an entire decade if not more. Cheap interest rates have created bubbles everywhere, which now are likely to burst across many asset classes as those interest rates inverse for some time at least. This is problematic, as it can severely reduce the quality of banks’ balance sheets, cause large unrealized losses, or even cause insolvencies on a large scale of corporations or other businesses that operate on low margins or high re-financing needs. This is what happened in 1929 and the ingredients this time are not that different.
Some fragility signals of 2022 and 2023 so far:
-banks (SVB, FRC) failing
–crypto corporations (FTX) failing
–higher inflation and interest rates (reducing incomes, tightening credit conditions)
The issue on why we might face recession is because of severe tightening in monetary policies globally (QT+rate hikes) leading to credit freeze and fall of some financial institutions, potentially opening doors for large-scale defaults later this year. The chances of cascade in defaults are real, because as the bubbles across asset classes deflate (such as stock prices or real estate) it creates an environment where the financial institutions cannot recover easily or prevent deposit / capital flight, and the only way to prevent further defaults is for central banks to provide supportive policies of expanded liquidity, QE and lowering of interest rates to re-inflate the bubbles.
In other terms, multiple problems would have to be quickly addressed as of the writting of this article to prevent more banks or critical financial institutions to get in trouble over next 12 months, but there is one “solution” that fixes most of it, which is: Reinflating the bubbles. And since we know re-inflating the bubbles is not on agenda list of central banks for many more months to come (to keep inflation down), those valuations of financial assets will likely still come lower.
Let me outline first something that some in trading/market communities are already missing and barking at the wrong tree. This is not about “watchlisting potential banks that might fail” by looking at top 5 most exposed banks. And then using those to project how deep the credit event might be as result.
All major economic crisis in the past are result of cascade events, which means that figuring out which institutions has potential to fail or not makes little value on projecting the depth of crisis or where the crisis should end, because the magnitude of spread-cascade is always highly unknown.
When the cascade begins one does not know where exactly it might stop. This is why looking at potential crisis through the window of few potential banks that might fail is wrong way to think about it.
The better way is looking at the bigger picture, the cycle and all asset classes and their re-pricing potentials. If interest rates stay high for while, and if more insitutions fail, and if current ongoing credit freeze keeps going for a year, it will lead to very likely deflating of asset prices further down the road, which in itself has potential to create increased unrealized losses within both financial markets and economy.
In my view as this was one of key igniting factors of 1929 crisis, so is this time as that is one of the biggest weakness that entire financial sector and economy is exposed to. The asset bubbles deflating. Crypto was first. Equities are within the process. Real estate is within the process. Bonds are within the process. Crytpo and equities are not the most problematic, its the later two asset classes that can cause significant issues.
The effect of demand destruction policies of 4th turning cycle (“control the inflation at no matter what cost”)
As mentioned above, to understand why recession or depression is a likely outcome, we have to outline where we might be on the timeline of the 4th turning and the (partial) de-globalization that plays a role within it.
If enough things are broken down within this process over the next two years, avoiding a deeper economic crisis is unlikely unless the central banks and fiscal policies would be providing the system with liquidity, which we know is not happening as we are in the cycle of tightening currently. Demand destruction policies are likely to yield the result as follows:

As the image above suggests 2010-2021 was the era of deflation and expanding globalization to where the 2020 might have been actual peak. 2022-23 was so far a (early stage) cycle of inflation, and possibly if the crisis is deep we might see a significant crash of inflation perhaps even into a deflationary spiral over 2023-24, until the central banks pivot on the policies, and the inflationary cycle picks up once more. Whether they really will do such a thing and pivot in 2024 we are yet to see.
Over-reaction as a theme
The large chunk of issues that come about over the past 2 years in markets were due to the first significant and unusual reaction (overreaction?) to the covid situation. This caused supply chains to malfunction and hiked global inflation.
The second part of the damage was done through an unusual reaction (over-reaction?) of a very fast interest rate hiking cycle, forcing assets to reprice to downside fast, and obviously, as a result, expose a bunch of institutions to the failure.
Do you see the theme yet? Its global. Its fast. Its over-reaction. And it leads to disruption. Whether this is newly established theme or just a two sequence and done type of a thing we are yet to see, but in the context of 4th turning it makes sense to be a theme following.
The reason why highlighting 4th turning once more is to understand that in 2021 or 22 the economy or financial markets have not been breaking down mostly because the system was flooded with liquidity. This delayed the crisis and recession aspect by a year or two perhaps. Now that this delay mechanism was turned off in early 2022 gradually, it is likely that the economy and financial asset classes will be met by the reality of all the damage that was done through the early 2020s lockdown policies and supply chain damages, geopolitical frictions, and result in a slowdown of global growth, deflation of asset prices, defaults and more.
All of the mentioned variables above are in play now to the extent that the damage will be seen and reflected in both economic data and financial market issues within the next 6 months possibly, and to good extent already being present.
It seems like the fall of asset prices is the core issue triggering cascades in many places if one tracks the stories across all markets so far over past 12 months.
The first being the fall of crypto assets caused the weakening of balance sheets of many banks and corporations that carried crypto exposure through VC, loans, or derivates.
The chain reaction, therefore:
-Decline of crypto asset prices-triggers
-Fall of exchanges (FTX)-triggers
-New unfriendly regulation furthering pressure on exchanges (Bitrex, Binance…)-triggers
-Bank failures (Silvergate)-triggers
-Creating issues for other banks that are exposed to failing banks (but not crypto directly), pushing the domino effect further even if crypto prices stabilize
Crypto was first chain of asset classes that broke in 2022. But more are within the process currently. Second were the bonds. Decline in bonds triggered large unrealized losses across many US banks, which made few of them (SIVB, FRC, etc) fail. The sequence of events is similar to the one outlined above for crypto. Higher liquid and most bubble inflated assets crashed the deepest and first, causing first avalance of issues over past 6 months.
From this point on is where one has to project forward and why we are likely only at beginning stage. What will likely come next is all the “slower” assets, less liquid ones such as real estate (CRE especially) or equity prices in general (indexes) if they start to deflate and hold selling pressure over next months, it is possible they would worsen the loan books and balance sheets of banks further, creating secondary wave of failures possibly. Those asset classes represent much bigger cluster of regional banks portfolio holdings. Only few banks had exposure to crypto markets, and only few had very high exposure to bond markets, but many more have exposure to real estate, and other asset classes which are slower in response to the hiking cycle downturn (which have not yet been “in play”). Or with other words, those are asset classes that take three years to unwind to their lows after the hiking cycle starts, unlike crypto for example which reacts and re-values very fast. If we see consistent declines of real estate and consumer demand for loans pluments along side, it is likely that we have more failures in banking sector or at least more downturn in equity markets as unexpected issues come to the surface, which markets have not yet priced in.
This especially to equity markets going forward means, its not about what has been priced in. Many assume SP500 will not fall any further as majority of bearish sentiment has already been priced in. The issue with such argument is that it assumes you see whats under the surface of water, the part of iceberg you dont see is typically what causes the major recessions and declines in markets, the unexpected issues that come to surface.

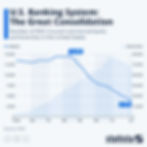
Consolidation of banking sector by large banks (JPM, GS, etc)
If the crisis drags for a while with significant credit and consumption freeze larger banks could outstays smaller ones in upcoming crisis, if it really was longer one. It is possible that as a result because larger banks are much more capitalized and have healthier balance sheets, they might be able to endure the crisis, while some smaller regional banks get into strains or even become liquidated, and absorbed by larger banks.
Recent “absorptions” of JPM are the first sign of the theme that might unwind in upcoming months with perhaps more of this to come. The point raised here is that this is not just one or two off type of thing, but perhaps a theme to be established. Assuming the strain in markets does remain of course for while to come.
The US banking system has been shrinking in the number of participants and consolidating to ever bigger-big banks over time, and the current potential crisis might just be one of the additional steps along the road to repeat the same pattern in place. Therefore this is nothing unusual within the big picture, it is just that potential for this to speed up is there if there were to be a depression event with prolonged issues on the horizon as one seen in 1929.
Depression-like crisis (due to liquidity issues in markets and no room to stimulate quickly (central banks actions capped by inflation).
As already stated in the prior article of the 4th turning, we are facing currently certain conditions that were both present in the early 1930s and 1970s. Each of those early periods significantly disrupted economic growth, and financial markets and created turbulence geopolitically. We have replicated so far a good chunk of those variables already.
This ties into the potential for an economic crisis due to change in status quo with harsher economic conditions present. There is presence of asset bubble deflation this time (due to shock in interest rates) just as it was in 1929 (the great depression), and meanwhile, we have the presence of elevated long-term inflation likely to come over the next few years due to geopolitical disruption (Russia-Ukraine, China-Taiwan), just as it was the case in the 1970s due to cold war 1 and the inflation buffers we have seen through entire decade being elevated (into mid 1980s).
Both 1930s and 1970s delivered very poor performance of equity markets, creating recessions, and other economic issues. As someone who tracks cycles closely and trying to spot the pattern similarities, there is much to be stated on why we are likely replicating both of those periods in combination. Those aren’t “potential” or “future” impactful variables that could mimic the history of those two examples, but rather something that is already visible as of now, and the rest half which has potential to replicate further. This creates an increased chance that we might see the reflection of this in the economy and financial markets this and next year. Therefore if you believe that similarities are true, one has to ask a question how likely it is to not see a recession or turmoil in equity markets, or in best possible version a “soft landing” at least. Assuming as a part of “soft landing” we see equities staying neutral for 2 years and there are financial institutions failing but it is all “contained and controlled”. It is important to remain open minded as both of those scenarios could happen, but as per my personal input i believe soft landing has lower chance of happening as that is what article argues.
The value of unemployment data on timing the event
If one was to assume there might be downturn in play, using leading data vs lagging is important to establish the right timing. Unemployment data such as NFP becomes a focus in the middle of an event often rather than ahead of it. This is because the layoffs start when things start to break down in economy or markets very obviously, which is in the eye of huricane, rather than ahead of it. Clear response with negative prints on NFP therefore a confirmation data, not leading data source. Soft weakening with multiple months of weaker prints can however help to establish a soft recession as probability at least.
To keep the summary short: In many cases of prior recessions unemployment worsens only after credit event is already well under way and obvious to everyone.
The chart below suggests deeper NFP prints in prior recession only started when crisis was right under way (September-ish 2008).

Decline in real estate prices
From the real estate market perspective, it usually meant a red year=bear cycle going forward (with a 3-5 year duration). We have seen RE prices within US (in many states) and many other inflated markets decline for the entire past 12 months since aproximately late July. Generally historically this is the start of bear market in RE, leading to few years of downturn. This is correlated variable aligning with potential recessionary downturn across other asset classes as well.

Do not mistake deflationary crash with healthy deflation
A deflationary crash leads to a credit usage freeze, leading to the liquidation of assets. Meanwhile, a normal deflationary environment (in non-crisis times) is positive for assets if supported by stimulative consumption and central banking policies.
The idea is, if there were to be a deflationary crash it would be bearish for asset values until the central bankers step in and stimulate to invert the process. Until that happens it would be very bearish, and likely that the time horizon would last by a minimum of few months up to many more, using some (but limited) historical references. The idea is, even in the best-case optimistic scenario of “just few months”, the asset prices such as stocks can crash significantly just within that short duration, as they have for example in the 1930s.
If we were to replicate banking issues once again on more global scale, those are examples to study from for potential scenarios: Greece 2015, Ireland 2014, Argentine, Germany 1921, USA 1930s…
But it is perhaps a big stretch to assume bigger bank issues could happen because we are often in disbelief when no issues were present for a decade or two that something might turn upside down now all of a sudden. History tells you major banking crises go in cycles and do happen every so often in large chunks of countries. If there is enough friction built in the macro environment it can increase chances significantly as we see currently.
The role of crypto in the potential downturn of bearish cycle later this year

Perhaps one of the interesting asset classes going into a possible downturn might be crypto because there are many views that one could make to support both bullish and bearish case for Q3 2023 to Q2 2024 performance. The picture can get very mixed if we assume that a deflationary bust of assets and recession is in front of us (with deposit flight from banks not being solved yet), those might be valid inputs to weight the value of crypto going forward:
Bitcoins’ role “caught between the rock and the hard place”:
-Upcoming regulations and lawsuits could be very damaging to prices short term.
-Bitcoin could become a perfect capital flight function if a major banking crisis was to happen (and those in control already know it) which means the chances it would be allowed as such easy-to-access gates are small most likely. This is why regulation in many countries might be implemented to prevent it being a capital flight function when time for its need becomes the greatest. We see steps being taken towards that direction over past several months, the question is where does it stop? Or would the crisis escalate first before regulation gets finished, therefore allowing capital flight functioning of Bitcoin to shine? This paints very black or white outcome.
-Lack of proof of positive performance in history of major recessions. Bitcoin has not existed in 2008. It was present in 2020 and has not performed well at all within the deflationary bust of March/April. It plummeted just like all other asset classes. This is why this time if there is a similar deflationary crisis event it might not be any different. People might liquidate what they can and what they have as excess holdings if crisis is deep and long enough.
-The bullish version would be no credit or liquidity crisis event in next 12 months, but only a very slow drift into recession with plenty of banking issues in between (but controlled by FED/FDIC), meanwhile regulation is unable to stem the use of Bitcoin. That scenario could be bullish to a good extent.
Those are some of key points to keep in mind for projecting what could possibly happen to crypto prices if we assume recessionary environment with capital flight being present. There is much more to list but this is a start, and the conclusion being, the outlook is unclear and very mixed with a lot of uncertainty.
Lets highlight some macro data to support the view of an upcoming recession, depression, crisis event, or possibly a combination of all in upcoming 12 months:

From a probability perspective, likelihood (personal subjective reasons supported by data):
-Mild recession (very likely)
-Liquidity/credit crisis event (likely)
-Prolonged depression (less likely but still possible)
Regardless of whether we get a credit crisis with the resemblance of 2008, the recession is in front of us. The economic data is weakening across many different sections enough to establish the view of likely recession over the next few months, which could last a year or more in duration, using historical averages as a guide. This part is relatively easy to figure out, and less interesting because a mild recession is not going to likely pull asset prices down too significantly, nor cause too harsh economic damage. From asset prices overview and projection, what matters more is the “unseen yet”. The unknown.
Projecting credit crunch with liquidity crisis following is where things open in up severity of scenarios. This is where the impact on markets and asset prices along with the unemployment spike can become a potential. We have already established data across Germany and US which suggests that credit freeze is already happening, RE and mortgage markets especially.
The third scenario is economic depression which means prolonged recession with the flavor of bank failures on a larger scale present and asset price collapses. The main reason in my view why this scenario could happen is due to the “everything bubble” deflating at once. Bonds, real estate, stocks, crypto, all assets that banks might have exposure to on their balance sheet deflating at once, creating holes and liquidity issues or insolvencies for banks or other financial institutions.
If depositors would start to question the bank’s ability to pay them out it could create further issues. This is a potential scenario which is not 0% probability, but quite a lot higher than that, altough the real extent of potential happening is uknown to anyone.
Lets highlight some key macro data charts:
Commercial real estate (CRE)
Bank exposures to CRE sector and potential issues that could begin if CRE valuations were to decrease, if demand for CRE was to decrease, which likely it will using recession as determining factor.
Below is chart of regional bank and their exposure to CRE sector, which is quite high. This number does not tell us much, other than the fact, if CRE prices were to significantly decline, it could create more (yet unseen) issues for those regional banks.

Good overview on CRE sector and RE in general is done by this individuals with plenty of content on Youtube channels if you wish to check some of the material:
https://www.youtube.com/@RJTalksTV
https://www.youtube.com/@ReventureConsulting
https://www.youtube.com/@EPBResearchlarge
Yes they are all quite bearish in outlooks, but for good reasons. CRE is being highlighted across as the asset class with most likely further declines happening and the issues it could create to regional banks (already facing large unrealized losses from bond price declines).
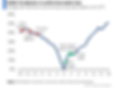
M2 growth decline on year – year basis:
Perhaps one of the more significant data references is the change in M2 present this year, as it marks the second harshest drop recorded over the past 100 years. And not just that, we have created here an HH LL pattern (higher high-lower low) with sharp reversal, which in technical terms usually leads to a further deeper decline.
This means money growth is declining fast, leading to potential liquidity or credit crunch as a result somewhere later this or next year. M2 has significant implications for broad economic activity as well to markets, it is not to be underestimated.

On the conceptual chart below is HH-LL pattern and its usual path projection:

Credit default swaps spiking


Credit default swap prices have been soaring over the past year across certain banks or government bonds to the levels that are highest in many decades. This shows the chances of defaults or the costs to insure against defaults have been rising fast. To keep it within perspective, many CDS charts have not seen levels this high even in the depth of the 2008 crisis.
CDS spikes are showing cross-financial sector/insurance and credit strains. This is the biggest spike on record for many institutions, the spike is that much stronger already before we have seen the real depths of the crisis yet, as the 0% bubble that was babysitting for decades is now bursting across many asset classes.
Tightening of credit
The chart below creates an overview of how credit/lending contracts into a recessionary environment, and typically causes the crisis event ignition, or happens it tightens in the middle of it as a result of it.
We are currently sitting within the nearby territory of prior crisis events, credit tightening is already in motion and well visible in certain parts of the economy. Usually, the reversal only happens well after the FED already shifts policy into rate cuts with a few months of the established path and no sooner. We are still far away (1 year+) from both of the curves to inverse down most likely because of it. This chart is critical to understand because many believe that FED will start cutting rates soon and improve conditions in markets and financial sector. The chart below suggests otherwise as historically even after FED starts to cut rates, the credit conditions keep further tightening for months, until they start to improve. Meaning that as FED is cutting rates, the tight credit keeps dragging economic activity and markets lower. This explains why markets typically fall the most when FED actually starts cutting rates (after hiking cycle).

Real estate building permits and units under construction
On the image below is Real estate, building permits vs current units under construction. The chart suggests (from personal conclusion), the freeze on lending and slump in future permits will lead to stopping in new construction units soon (few months), which will lead to upper red curve slumping down and snapping towards the blue, but the snap distance is huge this time, which will lead to large loss in employment of construction sector within the US, leading to significant factor for deepening the recession possibly.

What is so unusual in the graph above is the gap between the BP and CU, which is one of the historically biggest gaps. To keep it under brief outline, the 2021 liquidity boom and influx created a large demand for real estate, and a large building and construction boom, as one can notice by just how much the curve jumped within just two years.
However rate hikes within the past 6 months have turned real estate prices south, inventories are now starting to increase significantly across the entire US and the chances are there was an over-building process that will end up with a freeze and will result in consistent pressure of elevated inventory levels of residential and commercial units, preventing prices to recover. It will take a while before both curves meet, and chances are the snap south on the UUC could be fast during a liquidity crisis event if it was to happen.
Real estate personal projections

Deposit outflows
Deposits have been leaving the banking sector for a few months by now at a historically significant pace. Some of the reasons are fear of bank losses or undercapitalization and some are due to banks not creating enough competitiveness for depositors by providing high enough interest rates versus the money market funds.
Depositors are leaving towards the holdings where they get higher % return rates closer to current inflation since banks’ interest rates on deposits are still not moving much at all since the rate hiking cycle began in 2022.
The reason is actually pretty sound if banks across the US would catch up to the FEDs terminal rates, many banks would start creating monthly losses. This creates a situation where they are unable to catch up fast, while bond/money market funds can. This incites therefore deposit outflows/repositioning.
The bond market and yields start to play a major role in creating a strain on the banks, since we know what the “freeze” position of banks is, the bond market is not frozen in its rates. The rates can still move higher, if inflation was not to come down, or if the financial system were to come under further stress creating the reason for further moves in bond markets and lower liquidity (selling pressure and increased yields).
Below is chart highlighting deposit outflows and inflows of those into MMFAs:

If FED stops hiking rates in May, is this bottom in SP500?
Equity traders had a neutral-ish year behind them, with the FEDs rate hiking cycle being in front focus as blame material for poor performance across the equity markets. This is one of the reasons why many bulls can’t wait for the FED to stop hiking and finally get into the non-escalator environment on the macro policy side so that rate hikes are absorbed and equities can finally get a breather. Well, there is a major problem with this argument, using historical context.
In many cases historically when rates plateau in the later stage of the hiking cycle what follows next is a rate flat period for a few or several months, followed by rate cuts. However those rate cuts if they are done after a significant hiking period (rates going up 3% or more) will usually be the response to the liquidity crisis or turbulence within the financial markets, and not because the FED is “done” and can finally start inversing rates softly and in a controlled fashion. The assumption made (that FED is also projecting) is that what should follow next is controlled process of slow cuts, but history suggests turmoil is likely to be actual cuase that pushes FED into cuts. And that scenario is not bullish for equities. Not initially at least.
Inflation does not often come down fast just by itself there is usually a large slump south in inflation but not due to natural rebalancing of the economy and supply/demand factors, but because something starts to break within the economy or usually financial markets, which creates credit crunch or credit freeze, therefore plunging inflation down fast. Credit freeze then dampens the bank lending and spending within the economy, leading to a slump in inflation and therefore some financial institutions usually banks, going under or getting into serious trouble, creating large systemic risks. This is when FED starts to cut rates. So is this bullish for equities? Not, this is where the actual largest slumps in prices usually happen. Part of possible scenario argued on article is that this might be what is in front of us.
So while many on the bullish side are waiting for FED to finally stop hiking and to transit that train into the station of prosperity once more, what many do not perhaps acknowledge is that this is not the next station where a train probably stops. The next stop following might instead be the pain station. It is when something in some (or few) institutions starts to break, creating chaos in financial markets. Therefore there should be no cheering of hiking to be finally over, because likely what follows next is not pretty.
To summarize many participants expectations vs reality:

Using interest rate hiking cycle as projection of what might come next for asset prices, especially stocks and to summarize the points made above, why when FED starts to cut rates, thats when the biggest decline might only begin and not the other way around:
Above chart highlights what is happening to equity/stock market prices on average with historical examples during the hiking cycle and just right after them when FED pivots to rate cuts. That of course if hiking cycle is actually followed by recession, as that is not always the case.
The image highlights that most of the pain-to-equity prices are not done in the hiking stage of the cycle (early). Although that is when valuations are adjusting, the reality is what causes the biggest slumps in stock markets are not valuation adjustments to rate changes, but something within financial markets snapping, usually bubbles deflating or large institutions going under. This then creates a shockwave of defaults and opens up the path for unemployment increases and therefore quick repricing of stock prices.
Therefore we assume that the current bank failures that we have seen in 2023 Q1 between February and May are only the beginning warning signal and that potentially there is more to come, this could open up the path for cascade events, of which the depth is unknown. This event once it reaches its depth in a time horizon few to several months could then open the path for FED to pivot.
To layer this out chronologically:
1. First FED might plateau with rate hikes, possibly soon after May (1)
2. Secondly, a liquidity or credit event might happen, creating a banking cascade (2)
3. Event (2) needs to be “out there” for a few months before FED would respond with policies of easing because history tells us they do not come to the rescue right away usually
4. After a few months into the cascade event with multiple institutions failing, and severe asset price declines in stocks and RE markets, what could follow next is a FED pivot with rate cuts
5. Even after that happens, what the image above suggests is that it would still likely take a few months after that for the market to bottom because FED is cutting rates into a major crisis event, which markets would take as fear/weakness and not an easing/positive event. Easing rates into fearful event therefore not bullish.
The timeline above suggests that we are still quite far away from any potential major rally in equity prices, that assuming there is credit event or liquidity crisis happening (because without it obviously a rally could happen).
If a crisis event is a several months away from May 2023, and FED responds with rate cuts quickly, then we are still 2X of such duration away before the market absorbs both the crisis and FED pivot and spits out the bottom with reversal potential. This means most likely no equity bottom any time this year of 2023, and most likely significant declines in SPY / SP500 somewhen this year according. Again the points argued here are strictly from perspective if there was credit event with deep recession. If none of those two happen equity prices can rally higher into end of the year and after.
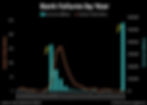
Early failures of banks are usually sign of upcoming troubles
So far in early 2023, we had a few institutional failures on the banking side, which in total already match to some extent what happened in 2007, which afterward resulted in a major recession and credit crisis.
Just as 2007 gave the early warning when Bear Sterns among other institutions was in serious trouble, and the real estate markets started to turn south early that year, along with stock markets starting to struggle, we have quite a lot of alarming similarities to that initial stage of 2007.
To highlight the size of current 2023 failures is at match to prior pre-crisis failures of the past 2008 crisis.
“This time is different”
And to be clear about one thing when you face a potential bear cycle and you are right at the top, commentators always use the reasons “this time is different because we don’t have X this time”. Meaning, the cycle similarities are correlated on 100 attributes, but commentators will always point out a few of those that are different and call the entire replication for the bearish scenario unlikely or impossible just because those few variables are missing. So there is a match on 95, but 5 are missing, hence it is not going to happen. Obviously, if you know anything about probability calculations that math makes no sense.
In every top of the macro cycle, such as crypto 2021 I have heard reasons from experienced market participants who said that crypto will not top out and go into a deep bear market this time unlike 2017 because we have X, Y, and Z conditions present which were not present in 2017. Yet if you do a top-down cycle analysis of all the overlapping variables, there is/was a huge match on about 70-80% of them. Sure few are off and not present, but the majority are. Usually, when that is the case, the replication will happen. And so it did as bear cycle in crypto of 2022 unfolded.
In my belief, we are facing the same situation this time. The similarities between 2007 and 1929 and some other recessions are significant. Once the crisis event begins it is likely that those “weakness conditions” get cranked up, and become a mirror of its past.
This does not mean 2008 or 1929 style event is a must to happen, it just means that the amount of data and variables pointing towards something of such mixture to happen cannot be dismissed, there are many factors pointing towards “something happening”.
Bank “lockdowns” 2020 style?

If the situation in deposit outflows escalates because the FDIC and other global agencies are unable to protect enough depositors (wealthy depositors flee), we might see coordinated global action to impose “lockdowns” on ATM withdrawals, on daily bank account sending limits and similar restrictions to prevent a full-scale banking collapse in certain countries or by certain institutions. To smaller or larger extent which is fully unknown.
You might be thinking this “thesis” is going over the board with “tin-foil-hatting” but that is how larger banking crises have unfolded in Greece, Argentina, and many other countries in the recent past (not centuries but just decades ago or less).
When things go bad, restrictions are imposed. Obviously, all of this dampens economic activity severely, creating depression.
This is just extrapolating potential scenarios, out of the variables that are currently present it would not be out of the question to see something as of such happen, if we see many more banking or other financial sector (pension funds etc) institutions failing, creating the need for lockdown on capital movement (to stop further failures).
The solution?: Diversifying cash and bank holdings across multiple and not just one institution is a good idea, along with having some physical gold, and cash which is not held by any institution or custodian with liquidity/solvency exposure. Placing some of the capital into US treasury holdings might also be a good idea.
The key is diversification, not over-weighting any of that exposure by single point, but spreading out if one believes the chances of bank lockdowns might be possible. Once those defensive moves are taken, there is nothing else to do but just to watch and hope it doesnt come to it. In worst case all those defensive moves create unnecessary actions that cost a bit of time, in best case if banking crisis does happen, those defensive moves can turn to be highly productive for individual taking them.
Potential for further financial institutions insolvencies is high

The credit freeze in the US as a result of such bank failures could spiral the credit freeze across the globe, even if the other monetary unions’ banking systems remain less exposed to the asset price collapses they would still feel the freeze of the US financial sector. This is, for now, almost non discussed story anywhere in the media.
In my view, we could see a significant number of institutions fail, which could perhaps be the highest since the 1930s great depression. This is a long answer to unwind and goes beyond the scale of a single article, but the fundamental issue is the asset price collapses impacting the failure in the US banking system leading to the freeze of global credit (since the US is the liquidity core) and creating troubles elsewhere (EU, Asia) even if those banking systems are not highly exposed to asset prices on their balance sheets (which they are not).
If you create enough fear and freeze within the US, the troubles spill towards the rest of global economies, we have seen that scenario play out in 2008. This is not a fictional or low-probability version, not in the situation we are facing currently where the broad variables suggest asset price-deflation has a pretty high potential of occurring.
It goes without saying that if such an event was to happen (a cascade of financial institutions failures in a number of 100s) the liquidity in markets would collapse, and the asset prices would tank. This would impact your holdings or trading edge within a period of 6 months.
Personal assets and positions (not financial advice)

The positions taken are for now only one third of total planned sizing/weighting, and are meant to be increased over next few months once the recessionary environment becomes clearer (but not too obvious to be too late).
Main focus, equity index:
SP500 (SPY) short
Main risk: Potential short squeeze on SPY before the crisis deepens later this year. Type 1 short squeeze into macro highs before the new macro lows on SPY is created.
Timing is key because of it, macroeconomic data has to respond with weakness across all components, and financial institution issues have to start ramping up, this might be the time to increase short position exposure with 6 months of downside window-duration.
Macro target 300 SPY.
Highly speculative recession-sensitive companies:
TSLA short
The auto industry performs poorly in recessions, TSLA valuation is very high and prone to re-pricing if economic demand turns sour.
Main risk: TSLA is a highly liquid ticker with major short squeezes often, and could still deliver significant rallies before it finally drops to the projected target of 100. It is often trading with a disconnect to SPY in mid-term, making it harder to time the movement.
Macro target 100 on TSLA.
Real estate:
SX40 short and TOL short
Main risk: In my view risks are low, because once RE markets turn, the downturn lasts for 3 years or more on average. We started to top out and turn in the late last year of 2022, therefore reducing the chance of significant recovery while the economy is in recession. Not without the help of central banking. Therefore the main risk and invalidation of the view on a major drop in SX40 would be only if FED pivots and introduces QE to re-inflate asset bubbles somewhen in late 2023. In my view this will not happen, not at least somewhen later in 2024.
Macro target 500 on SX40.
Gold:
Small physical long, and intraday/swing long opportunities.
Main risk: Interest rates staying up for too long preventing gold to rally even while financial institutions are facing deposit outflows.
It is quite a mixed bag, to summarize why if one anticipates a major recession or deposit outflow crisis, why longing gold is not super obvious. There are a few arguments for that.
Yes, it is true that in recessions or especially if there are systemic banking issues present the gold does well. However, in deflationary asset collapses gold tends to drop just as much as any other asset class. If we were to have a deflationary crash this will create a ceiling on a potential rally for gold prices, especially if inflation (CPI) prints come down.
If banking issues were to get severe, it could also be possible for the US to create restrictions on gold sales, confiscations, or other measures that have been implemented in similar situations historically. It would be naive to think that it cannot happen again. If such actions were to happen, they would be heavily bearish for gold’s price. Therefore bank deposit outflows are positive to the gold price, but only if they happen on a smaller limited scale. If they were to increase to the point where one wanted to long and anticipate a huge move, this is where the policy actions of restriction are likely to increase in probability, and therefore serve as a counter-argument for bullishness. Soft=bullish, harsh=bearish due to policy change potential.
Hedging some of the risk of capital holdings through physical gold is always a good idea, but not to overdo the sizing. As for trading CFD instruments such as XAUUSD, the opportunities on the long side are likely to remain present for the entire year of 2023 in my view but they might be met with severe downside shocks as well, making it short term timing opportunities mostly.
Conclusion
To summarize, confirmation factors for a recession or liquidity crisis are not just one, but many. So many factors align that now even FED is signaling recession as a very likely scenario which is very unusual. The article might be clumsy because it is in the end just a brief summary of my accumulated views across different market niches. Therefore no details and explanations are given for each sub-topic and it is expected of reader to be aware of the issues raised else it could be easily seen as “over the top” type of content.
The conviction on the upcoming slump of the economy into recession is high. So is the potential for liquidity and credit crisis that would happen in the middle of such a recession potentially.
Prolonged economic depression which lasts for two years is not out of the question.
From investing and trading perspective, the real opportunity is on the other side of such fence, once central banks do turn QE on once more, if asset prices deflate significantly before that it would allow scooping up cheap assets at much lower valuations. But let’s not skip time and jump ahead too much, before that happens we have at least a year of a turbolent environment likely, lets see where it takes us.
- SEO Powered Content & PR Distribution. Get Amplified Today.
- PlatoAiStream. Web3 Data Intelligence. Knowledge Amplified. Access Here.
- Minting the Future w Adryenn Ashley. Access Here.
- Buy and Sell Shares in PRE-IPO Companies with PREIPO®. Access Here.
- Source: https://www.tradethematrix.net/post/credit-freeze-and-global-recession-depression-in-late-2023

