As a SaaS founder, you’re well aware that churn is more than just a buzzword. After all, high churn rates directly impact revenue, growth, and the long-term success of a business.
You also probably know that managing churn requires a comprehensive approach that goes beyond customer acquisition.
While the significance of churn is clear, there’s a chance you’re not gathering the insights that could help you in actually reducing your churn.
Fear not! In this blog post, we’ll dive into three key insights about churn that can fuel your revenue growth strategies. So, grab a cup of coffee, get comfortable, and let’s get into it.
First… What’s the best way to calculate churn?
For SaaS and subscription companies, churn most often refers to users or revenue lost and is usually represented with either a percentage or dollar amount. There are two main types of churn:
Customer churn = customers lost over a period of time
Revenue churn = amount of gross revenue lost over a period of time
There’s different formulas out there, but here are the ones we use at Baremetrics:
Customer churn
(Canceled Customers in the last 30 days ÷ Active Customers 30 days ago) x 100
Revenue churn
(MRR Lost to Downgrades & Cancellations in the last 30 days ÷ MRR 30 days ago) x 100
Both types of churn provide value and insight into what’s going on, but revenue churn is generally the one you want to focus on more, especially if you offer a larger variety of plans. Losing customers is always bad, but the value of the customers you are losing is important to monitor.
For instance, if your revenue churn suddenly increased one month, it’d be helpful to know if that was the result from the loss of several smaller customers or a single, big customer.
Churn by Customer Segments
Understanding churn rates across different customer segments can provide valuable insights around who’s churning, when they’re churning, and why they’re churning.
A great way to do this is by segmenting your churn rate by attributes such as customer size (small, medium, enterprise), industry, audience, or geographic location.
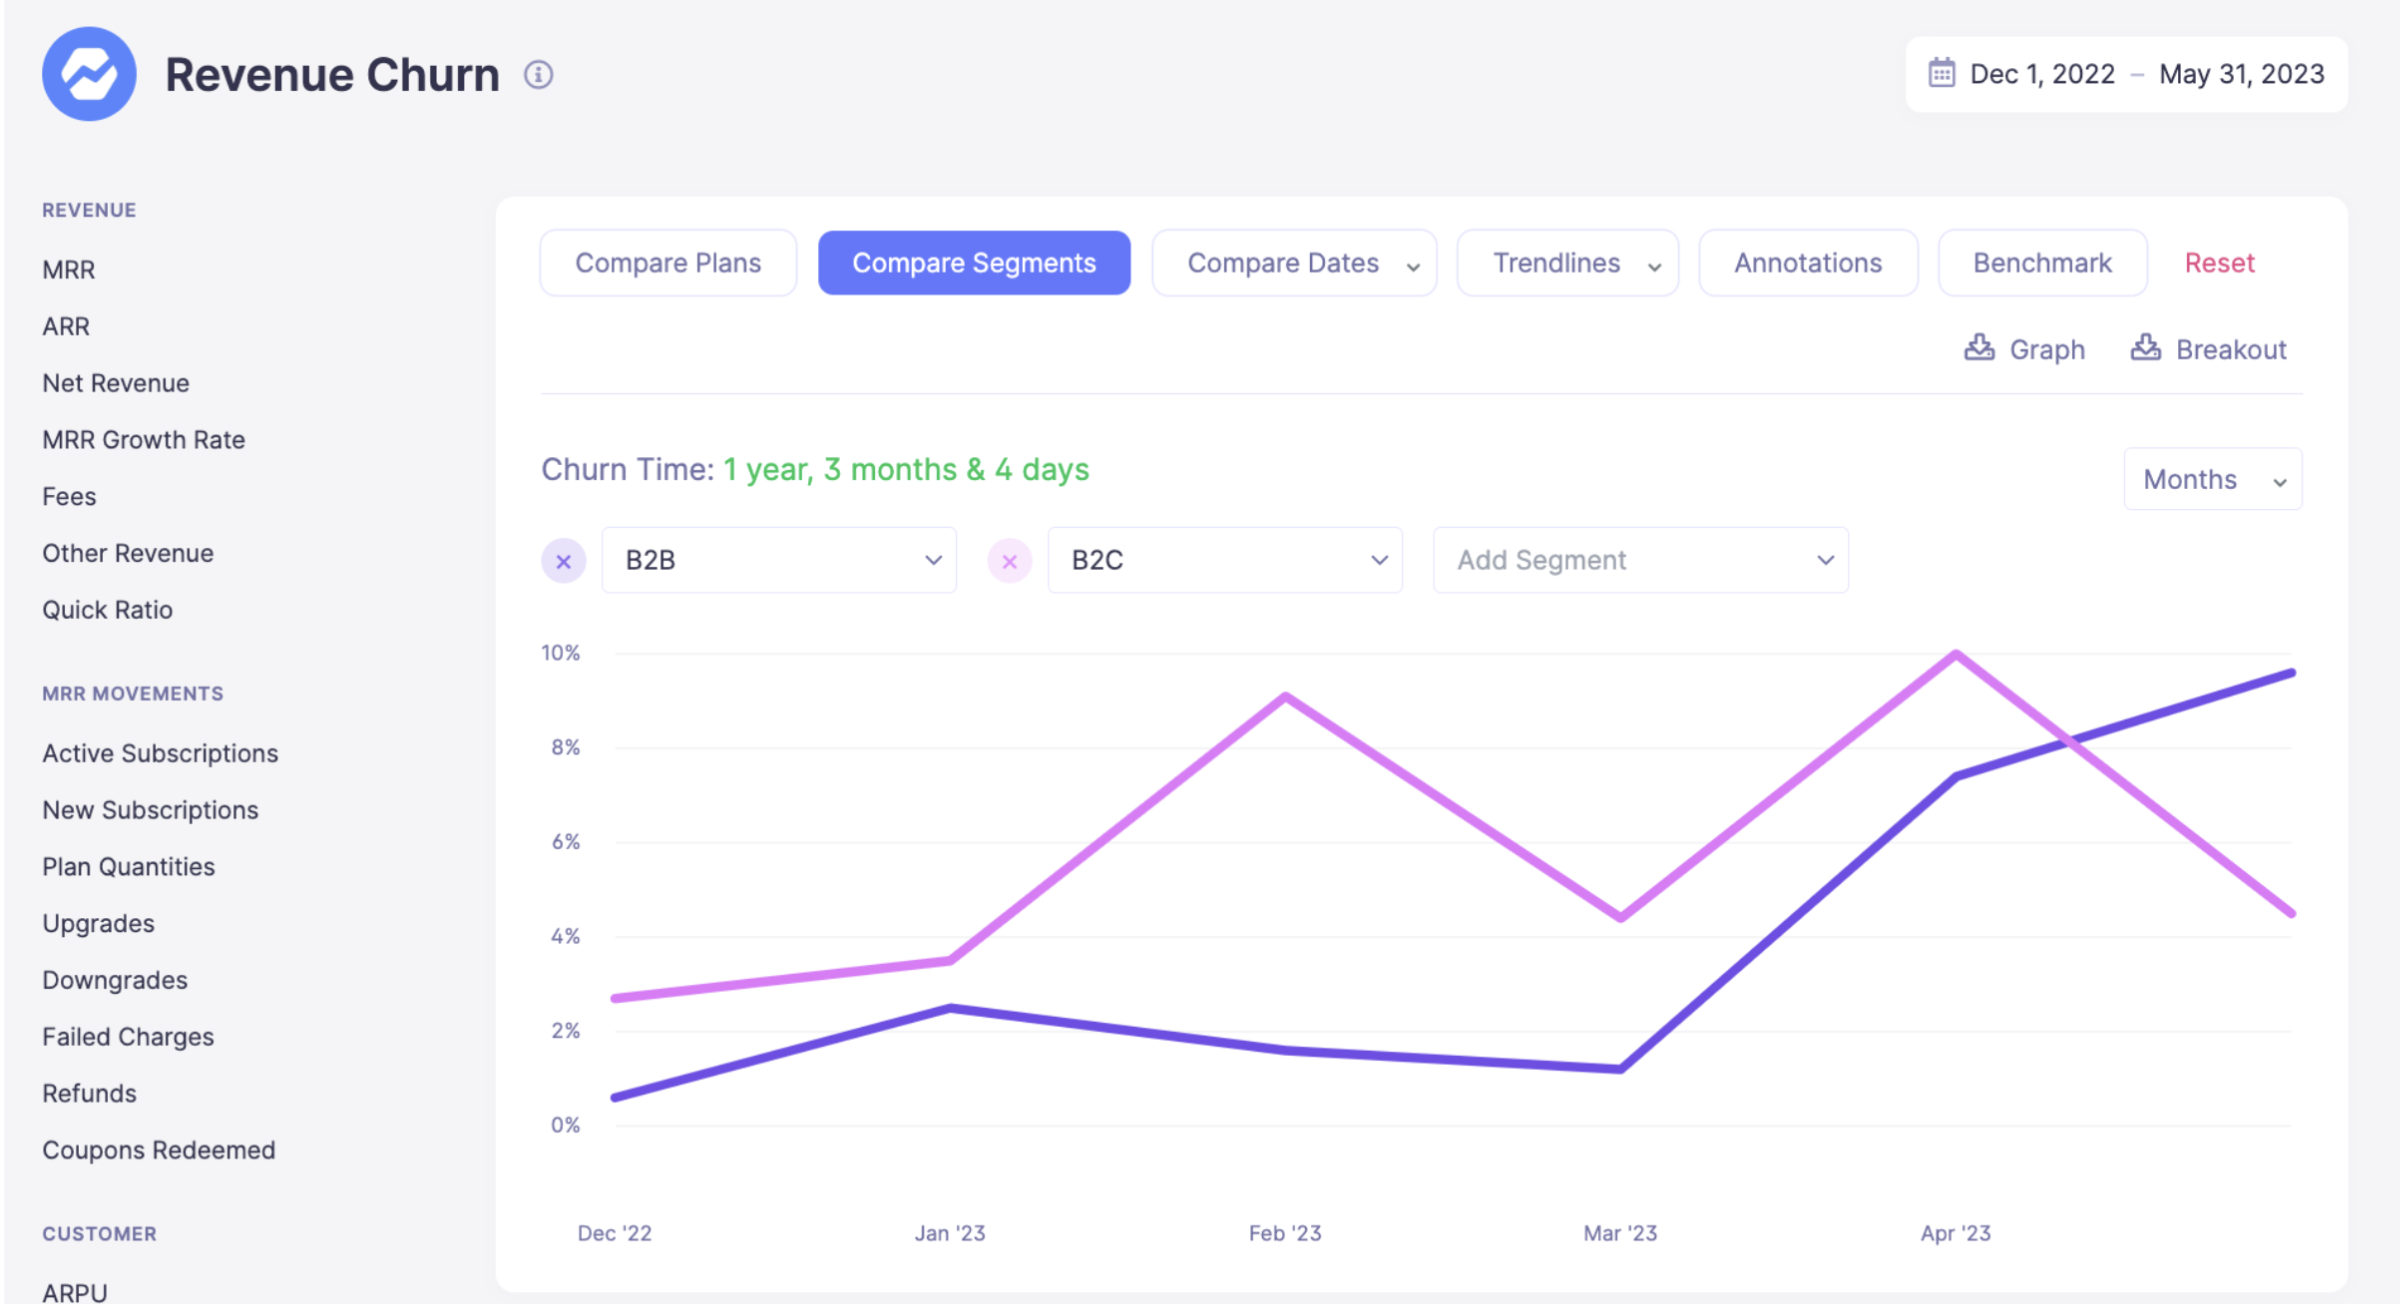
For example, check out this 6-month comparison of Revenue Churn between B2B and B2C customers. In December 2022, the cohorts had a similar churn rate.
Two months later, B2C churn spiked and remained significantly higher than B2B churn until April 2023. After that, B2C churn continued to decrease while B2B began to increase.
With this information, you could dig deeper into which customers were lost during this period and start to identify trends (more on this in the next section!)
Want to try segmenting for yourself? Play around in our live demo, no log-in required.
Churn Reasons and Patterns
Which missing features are costing you the most customers?
Which competitors are costing you the most money?
Are we attracting the right customers in the first place?
There’s so many potential reasons why a customer might cancel their subscription. But if you can narrow down the possible reasons to a short list, you can better understand which reasons are costing you the most revenue and therefore, where your team should be prioritizing focus.
Based on our data, some of the most common reasons for cancellations in SaaS include:
-
Too expensive
-
Technical issues with product
-
Customer is switching to another product
-
Customer is not sure how to use the product
-
Customer is shutting down the business
Insights around cancellation are some of the most actionable insights you can get.
For example, a customer that’s canceling because they feel the price they’re paying is too high for value they’re getting could be convinced to get on a call for a demo of the product, whereas a customer that shutting down their business is most definitely a lost cause.
Don’t have the time to manually ask your customers, compile their responses in spreadsheets, crunch the numbers, and send emails to incentivize them to try your product again?
Our Cancellation Insights tool has your back. Try it free for 2 weeks.
When in their lifecycle are your customers churning
In a perfect world, our customers would stay with us forever.
But since you can’t prevent customers from canceling, it helps to have an idea around when they’ll cancel. That way, you can better prevent (or delay) their cancellation.
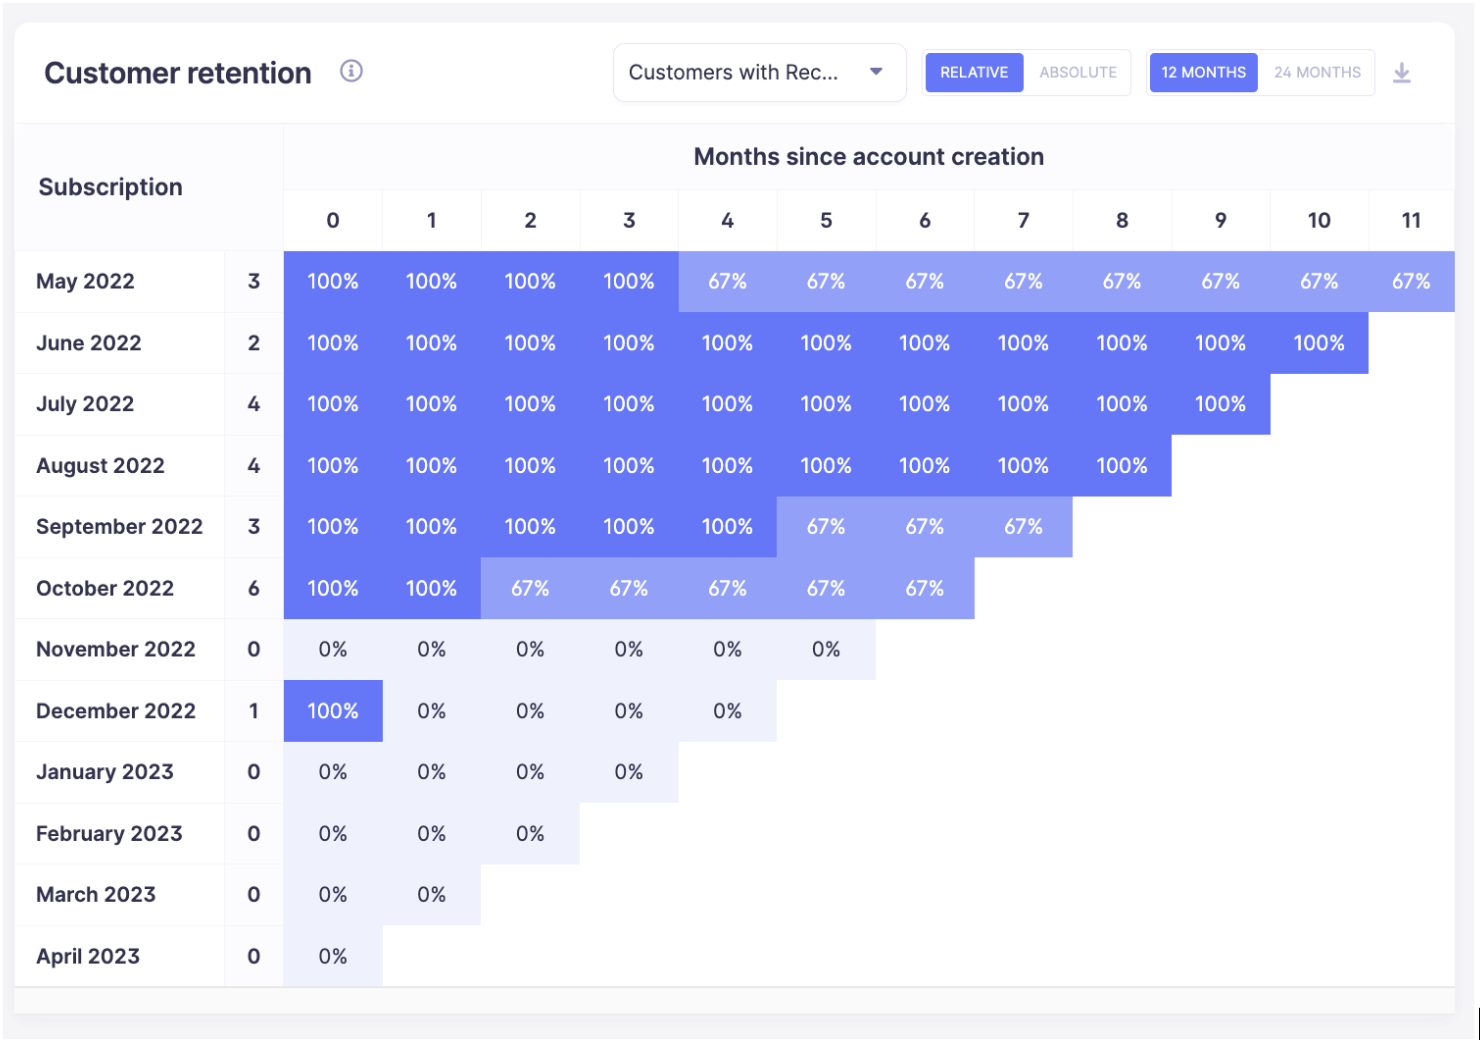
You can find this easily in Baremetrics. Our Customer retention table shows you when customers when in their lifecycle customers are churning. As you look from left to right, you can see what percentage of customers added in a particular month remain in subsequent months.
One handy way to use this is to compare the longevity of customers using your different products. For example, below is a table of our customers who use our revenue recovery dunning tool, Recover. Over these 6 months, retention is quite solid!
On the other hand, customers who are not using our Recover tool tend to churn sooner.
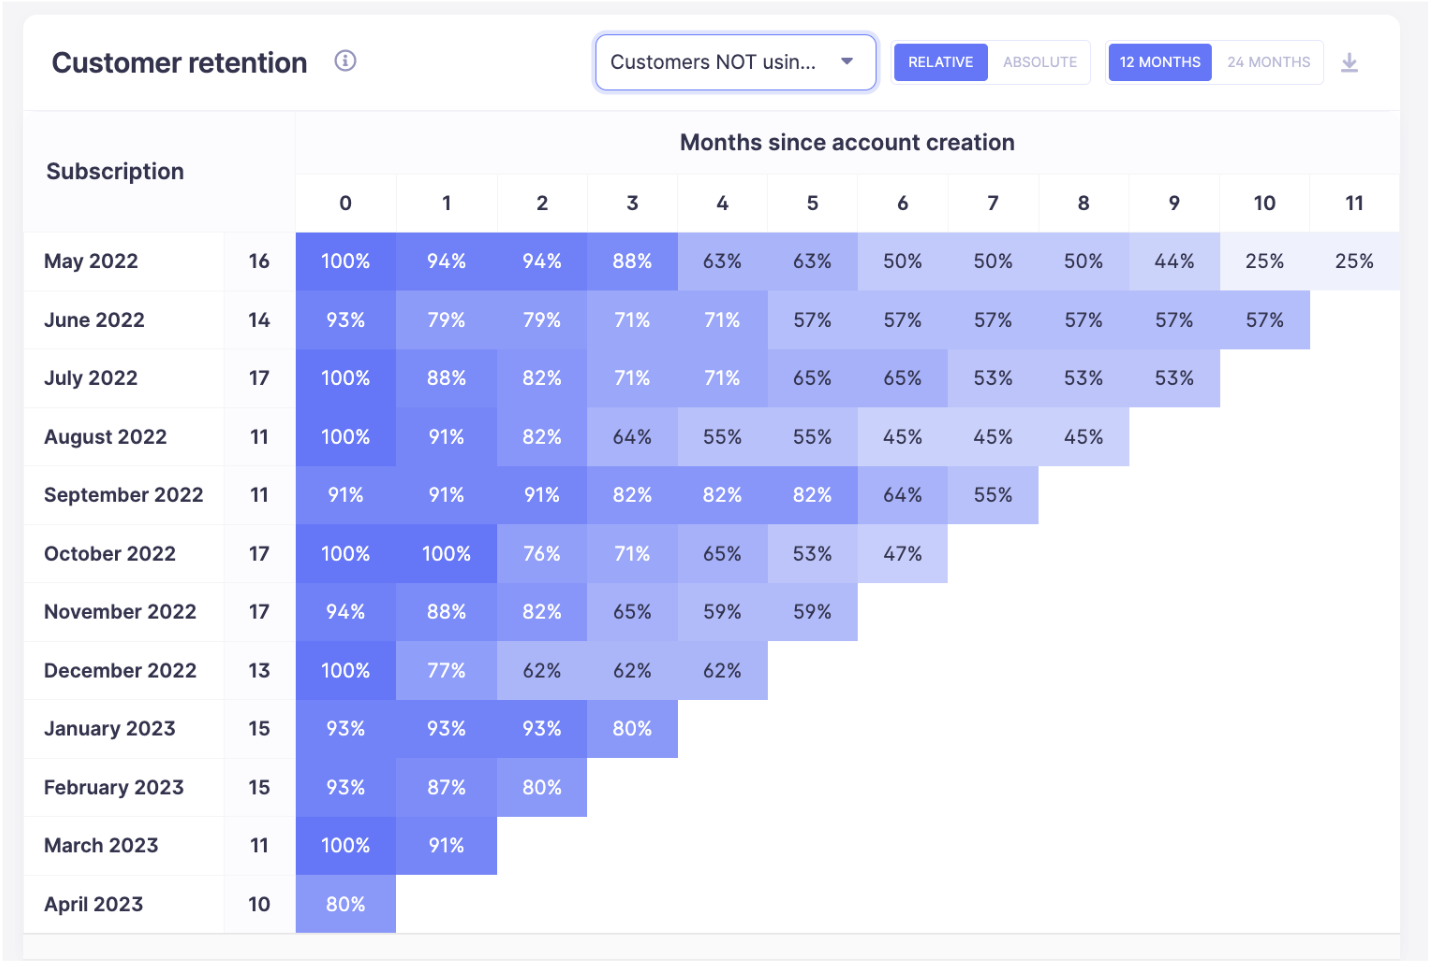
Customers not our Recover tool in addition to the core Baremetrics product.
The takeaway here is that Recover provides a ton of value to our customers. If we want to reduce churn and increase retention, getting more people to sign up for Recover on top of their Baremetrics account would likely be successful.
To take this a step further, we could do similar comparisons between different add-on products and launch a campaign promoting the most popular product.
Get actionable churn insights with Baremetrics
By leveraging these kinds of insights, you can develop targeted strategies to reduce churn, improve customer retention, and ultimately increase your SaaS revenue.
Baremetrics makes it easy for you to not only get these insights, but to take action on them, as well. Sign up for a free 2-week trial of Baremetrics to get started.

Reduce your churn
Over 900+ SaaS businesses use Baremetrics to measure churn, LTV, and other critical metrics that help them retain customers. Want to try it for yourself?
- SEO Powered Content & PR Distribution. Get Amplified Today.
- PlatoAiStream. Web3 Data Intelligence. Knowledge Amplified. Access Here.
- Minting the Future w Adryenn Ashley. Access Here.
- Buy and Sell Shares in PRE-IPO Companies with PREIPO®. Access Here.
- Source: https://baremetrics.com/blog/churn-analytics-3-insights-that-can-help-you-increase-saas-revenue


