Be the first to know when new content like this is available!
Subscribe to our newsletter to get alerts about new posts, local news, and industry insights.
Thank you! Your submission has been received!
Oops! Something went wrong while submitting the form.
It’s year end and time for all of us in the cannabis industry to do our 2023 strategic planning and budgeting. Cannabiz Media’s Business Intelligence Platform is rife with data to help you complete these projects in record time with an unparalleled set of data dashboards. You’ll be turning out TAMs and market share analyses in no time thanks to the graphs, charts, tables, and data exports we provide.
Total addressable market (TAM), also called total available market, is a term that is typically used to reference the revenue opportunity available for a product or service. TAM helps prioritize business opportunities by serving as a quick metric of a given opportunity’s underlying potential.
Here are some examples of how our customers are using these tools:
Inputs
Our industry is often described as a heavily regulated seed-to-sale agricultural vertical. Cannabiz Intelligence® has dashboards to help you measure these market dynamics:
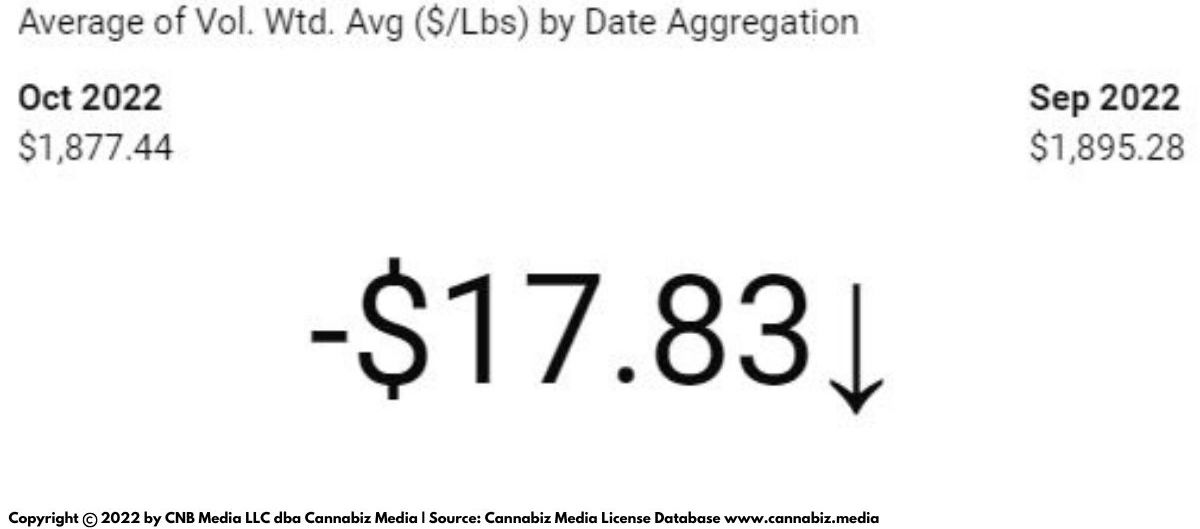
Wholesale Price of Cannabis
Through our partnership with Cannabis Benchmarks® we provide a topline view of the volume weighted average price of cannabis from 18 states from January 2021 to the present. Use this valuable information to create your own forecasts and run break-even analyses based on different price points.
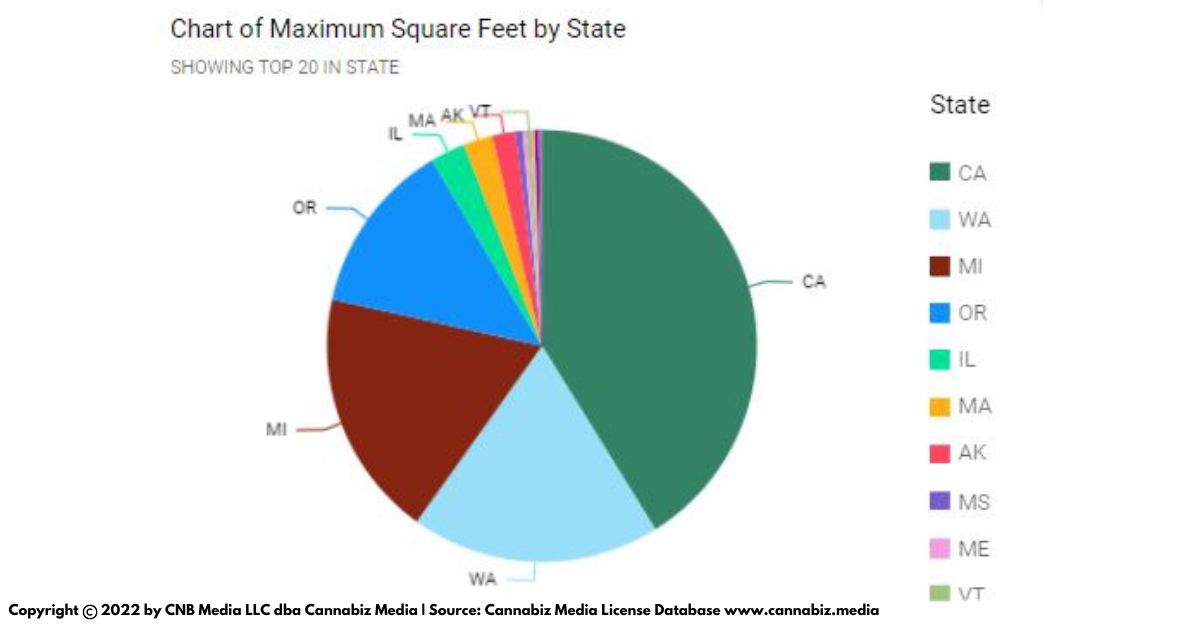
Canopy Size
From this dashboard, now in beta, we show the total potential canopy available in key states. It answers the question of how much canopy is available to growers, not what has been cultivated. We built it based on the number of licenses and the canopy sizes or ranges that are permitted.
Output
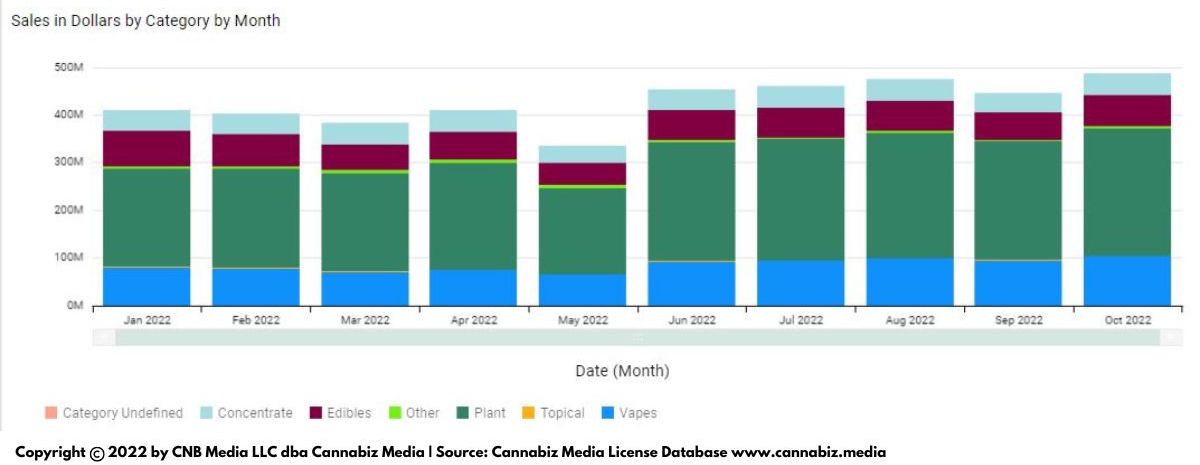
In addition to the inputs of price and canopy, we’ve also aggregated from further down the value chain. We can help you track demand via product and sales data as well patient count. Use this data for the following use cases:
- What is selling?
- Are sales up or down over last month/last year?
- What product types are increasing/decreasing in popularity?
Here are sales by category by month for 2022 for states that report this data.
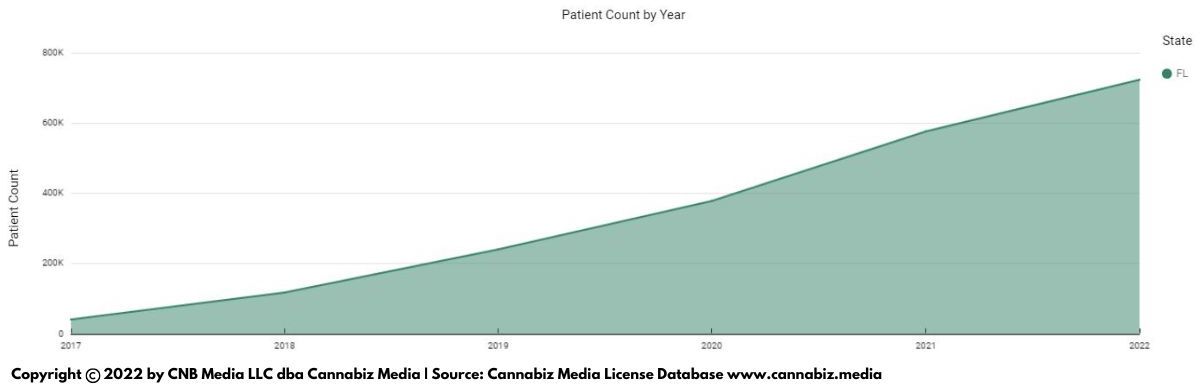
Patient Count Data
In medical only states, patient count shows market size and how it changes. In states with medical and adult programs, you can measure the likely decline in patient numbers as they opt out of government databases to purchase instead as consumers.
Here’s a graph of Florida patient count since 2017:
Distribution
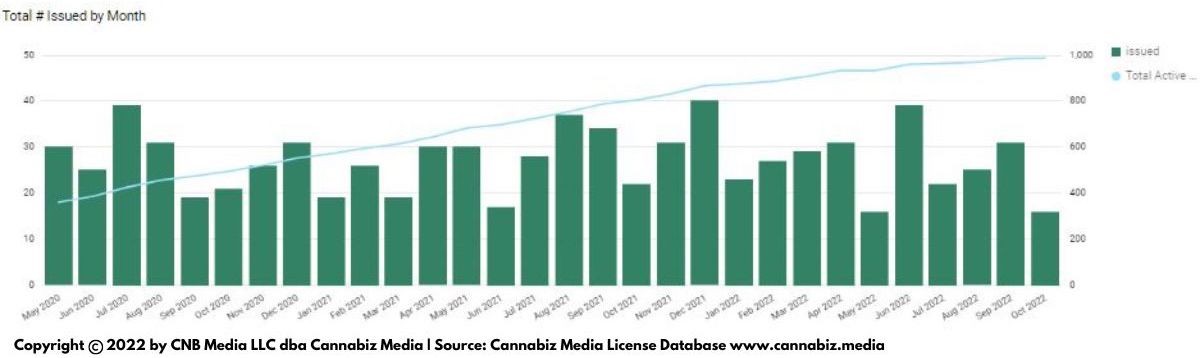
A key component in any TAM analysis is points of distribution. Cannabiz Media has been tracking this metric since 2015. Currently, there are over 10,000 stores nationwide. A variety of dashboards display counts by state, latitude and longitude, and how the number of stores has grown over time.
- License Census – How have the number of stores grown/decreased? Where do I deploy my sales force?
- License Census – Where are they?
Here’s a look at store growth in Michigan:
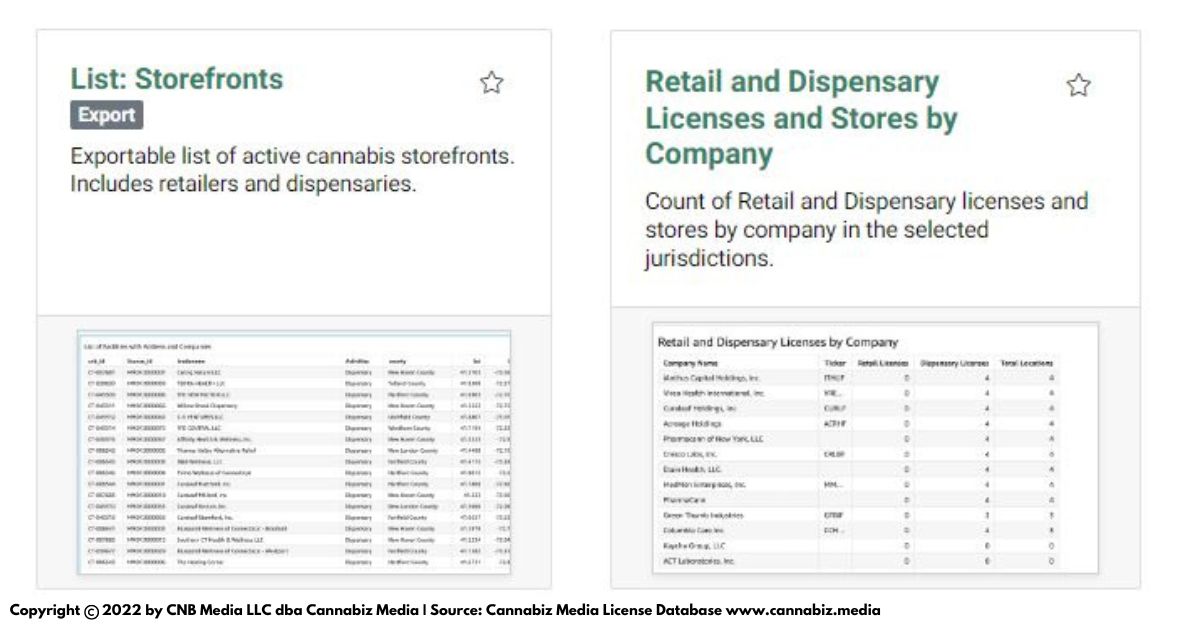
Other dashboards help users map out licenses and research corporate ownership:
Assets
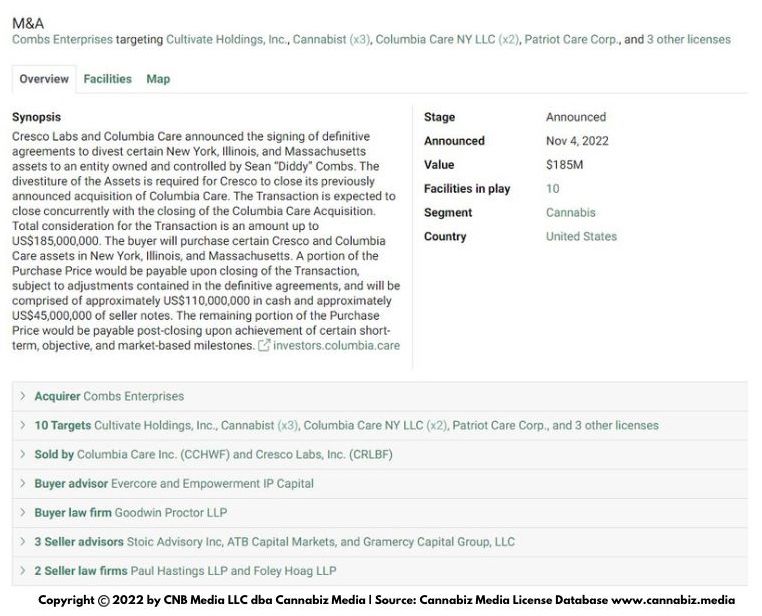
In addition to evaluating inputs, outputs and distribution, Cannabiz Intelligence also provides transaction details on close to 600 M&A deals. With this data you can see how much we estimate licenses sold for in various jurisdictions.
Here are some details on the Diddy Combs deal:
And the last asset class to review are leaseback transactions. Our Cannabiz Business Intelligence tool has captured data on over 100 of these transactions conducted by AFC Gamma, Innovative Industrial Properties, and Pelorus Equity Group. Companies that have participated in these deals include well-known MSOs like Curaleaf, Pharmacann, and Columbia Care.
Final Thoughts
The end of the year is upon us and the time for budgeting and planning is short. 2022 was a brutal year for the cannabis industry, and you’ll need good data to help you plan for success in 2023. We have compiled 28 data dashboards that put all of this information at your fingertips. Download what you need and create pivot tables, charts, and any other artifacts you need to make your case for 2023.
Schedule a demo to see how Cannabiz Intelligence can help you in 2023 and beyond.
Author
Ed Keating is a co-founder of Cannabiz Media and oversees the company’s data research and government relations efforts. He has spent his career working with and advising information companies in the compliance space. Ed has managed product, marketing, and sales while overseeing complex multijurisdictional product lines in the securities, corporate, UCC, safety, environmental, and human resource markets.
At Cannabiz Media, Ed enjoys the challenge of working with regulators across the globe as he and his team gather corporate, financial, and license information to track the people, products, and businesses in the cannabis economy.
Ed graduated from Hamilton College and received his MBA from the Kellogg School at Northwestern University.
Cannacurio is a weekly column from Cannabiz Media featuring insights from the most comprehensive license data platform. Catch up on Cannacurio posts and podcasts for the latest updates and intel.
- SEO Powered Content & PR Distribution. Get Amplified Today.
- Platoblockchain. Web3 Metaverse Intelligence. Knowledge Amplified. Access Here.
- Source: https://www.cannabiz.media/blog/cannacurio-62-cannabiz-intelligence-your-planning-tam-toolkit

