Out of all the crypto derivative products, perpetual futures have emerged as a preferred instrument for market speculation. Bitcoin traders use the instrument en masse for risk hedging and capturing funding rate premiums.
Perpetual futures, or perpetual swaps as they’re sometimes referred to, are futures contracts with no expiration date. Those holding perpetual contracts are able to buy or sell the underlying asset at an unspecified point in the future. The price of the contract remains the same as the underlying asset’s spot rate on the contract’s opening date.
To keep the contract’s price close to the spot price as time goes by, exchanges implement a mechanism called a crypto funding rate. The funding rate is a small percentage of a position’s value that must be paid or received from a counterparty at regular intervals, usually every few hours.
A positive funding rate shows that the price of the perpetual contract is higher than the spot rate, indicating higher demand. When the demand is high, buy contracts (longs) pay funding fees to the sell contracts (shorts), incentivizing opposing positions and bringing the contract’s price closer to the spot rate.
When the funding rate is negative, sell contracts pay the funding fee to the long contracts, again pushing the contract’s price closer to the spot rate.
Given the size of both the expiring and the perpetual futures market, comparing the two can show the broader market sentiment when it comes to future price movements.
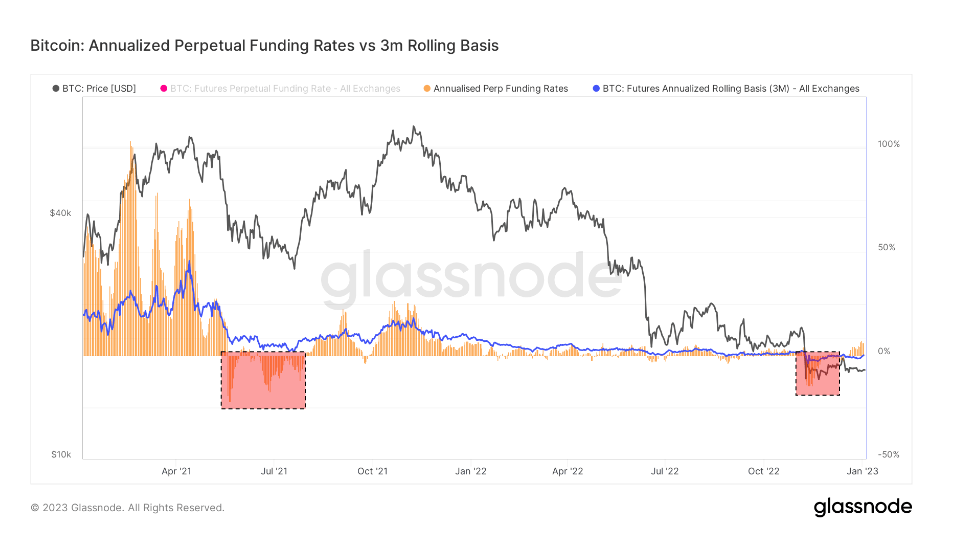
Bitcoin’s annualized 3-month futures basis compares the annualized rates of return available in a cash-and-carry trade between 3-month expiring futures and perpetual funding rates.
CryptoSlate analysis of this metric shows that the perpetual futures’ basis is significantly more volatile than that of expiring futures. The discrepancy between the two is a result of increased demand for leverage in the market. Traders seem to be looking for a financial instrument that tracks spot market price indexes more closely, and perpetual futures match their needs perfectly.
Periods where the perpetual futures’ basis trades lower than the 3-month expiring futures basis have historically occurred after sharp price declines. Large derisking events such as bull market corrections or prolonged bearish slumps are often followed by a decrease in the perpetual future basis.
On the other hand, having the perpetual futures basis trade higher than the 3-month expiring futures basis show high demand for leverage in the market. This creates an oversupply of sell-side contracts that lead to price slumps, as traders act fast to arbitrage down the high funding rates.
Looking at the chart above shows that both Bitcoin expiring futures and perpetual swaps were trading in a state of backwardation during the FTX collapse.
Backwardation is a state in which the price of a futures contract is lower than the spot price of its underlying asset. It occurs when the demand for an asset gets higher than the demand for contracts maturing in the coming months.
As such, backwardation is a pretty rare sight in the derivatives market. During the collapse of FTX, expiring futures were trading at an annualized basis of -0.3%, while perpetual swaps were trading on an annualized basis of -2.5%.
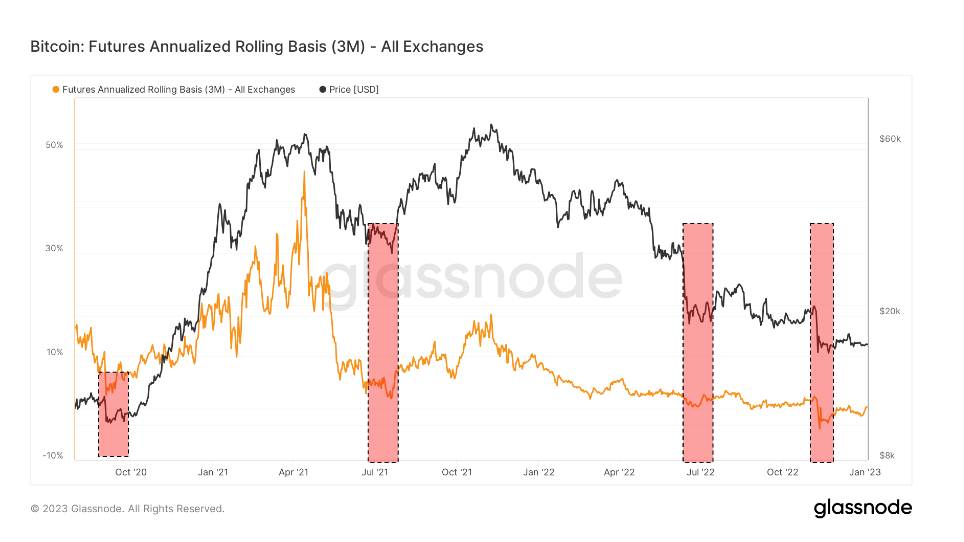
The only similar periods of backwardation were seen in September 2020, the summer of 2021 following the China mining ban, and July 2020. These were periods of extreme volatility and were dominated by shorts. All of these periods of backwardation saw the market hedged towards the downside and preparing for further slumps.
However, every period of backwardation was followed by a price rally. Upward price action began in October 2020 and peaked in April 2021. July 2021 was spent in the red and was followed by a rally that continued well into December 2021. The Terra collapse in June 2022 saw a rally in late summer that lasted until the end of September.
The vertical price drop caused by the FTX collapse brought on backwardation that looks eerily similar to the previously recorded periods. If historical patterns were to repeat, the market could see positive price action in the coming months.
At the time of press, Bitcoin is ranked #1 by market cap and the BTC price is up 1.06% over the past 24 hours. BTC has a market capitalization of $325.89 billion with a 24-hour trading volume of $12.84 billion. Learn more ›
Market summary
At the time of press, the global cryptocurrency market is valued at at $823.22 billion with a 24-hour volume of $26.36 billion. Bitcoin dominance is currently at 39.59%. Learn more ›
- SEO Powered Content & PR Distribution. Get Amplified Today.
- Platoblockchain. Web3 Metaverse Intelligence. Knowledge Amplified. Access Here.
- Source: https://cryptoslate.com/bitcoins-annualized-3-month-futures-basis-show-calm-before-the-storm/

