Bitcoin Price Prediction – May 12
According to the daily, the Bitcoin price continues to fall below $55,000 with a loss of around 3.98% from the opening price.
BTC/USD Long-term Trend: Ranging (Daily Chart)
Key levels:
Resistance Levels: $63,000, $65,000, $67,000
Support Levels: $48,000, $46,000, $44,000

Looking at the daily chart, BTC/USD is now falling below $55,000 with a loss of around 3.98% from the opening price to reach the $54,493 level at the time of writing. More so, the cryptocurrency previously experienced resistance at $58,041, which caused it to reverse and fall below the 9-day and 21-day moving averages. Such a noticeable drop in prices has raised doubts among the cryptocurrency community, as the drop has affected other cryptos as well.
Bitcoin Price Prediction: Why Bitcoin Price May Drop Further
The Bitcoin price is moving below the previous rising price as the bearish movement increases. However, breaking beneath $52,500 support might take the coin back towards $50,000 in the next few weeks of trading. Taking a look at the daily chart, we can clearly see Bitcoin struggling below the $55,000 level which caused it to roll over and drop. However, the coin attempted to find support around the 21-day MA within the channel but failed to hold this level and dropped beneath this support level.
Moreover, the Bitcoin price remains neutral but it is in extreme danger of turning bearish if the red-line of 9-day MA crosses below the 21-day MA. If this is the case, traders can expect support below the lower boundary of the channel at $48,000, $46,000, and $44,000 support levels as the Relative Strength Index (14) nosedives below 50-level. On the contrary, any bullish movement above the 9-day and 21-day MAs could locate the resistance levels at $63,000, $65,000, and $67,000. `
BTC/USD Medium-Term Trend: Ranging (4H Chart)
According to the 4-hour chart, BTC/USD follows the downward trend, bringing its price from $58,041 to reach around $53,560. If the price continues to drop further and moves below the lower boundary of the channel, it could reach the nearest supports at $52,000, $50,000, and $48,000 respectively.
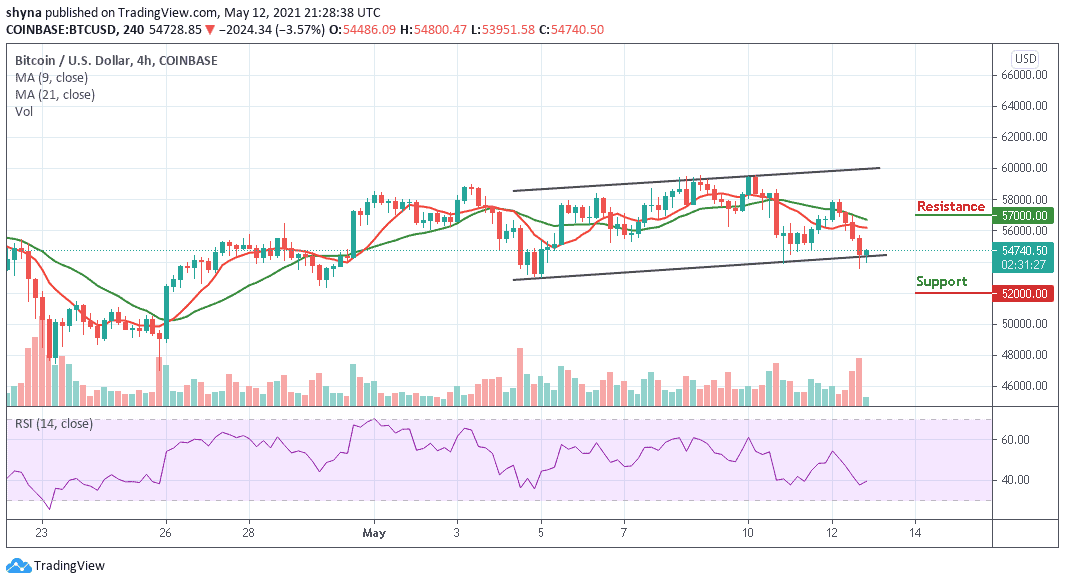
Moreover, if the bulls push the coin above the 9-day and 21-day moving averages, the price of Bitcoin may likely reach the potential resistance levels of $57,000, $59,000, and $61,000 as the technical indicator Relative Strength Index (14) is making a sharp movement above 38-level.
Looking to buy or trade Bitcoin (BTC) now? Invest at eToro!
75% of retail investor accounts lose money when trading CFDs with this provider
Coinsmart. Beste Bitcoin-Börse in Europa
Source: https://insidebitcoins.com/news/bitcoin-price-prediction-btc-usd-nosedives-below-55000-support

