Published 2 mins ago
The Bitcoin price witnessed a remarkable rally in the first three weeks of 2023. The bull run registered 42% growth from the January 1st low of $16499 and pushed the price to a $23400 mark. However, in the fourth week, the BTC started to show hesitation in a bullish recovery week, as several global events were about to unfold. Here’s how the largest cryptocurrencies may react amid upcoming events
advertisement
Key points:
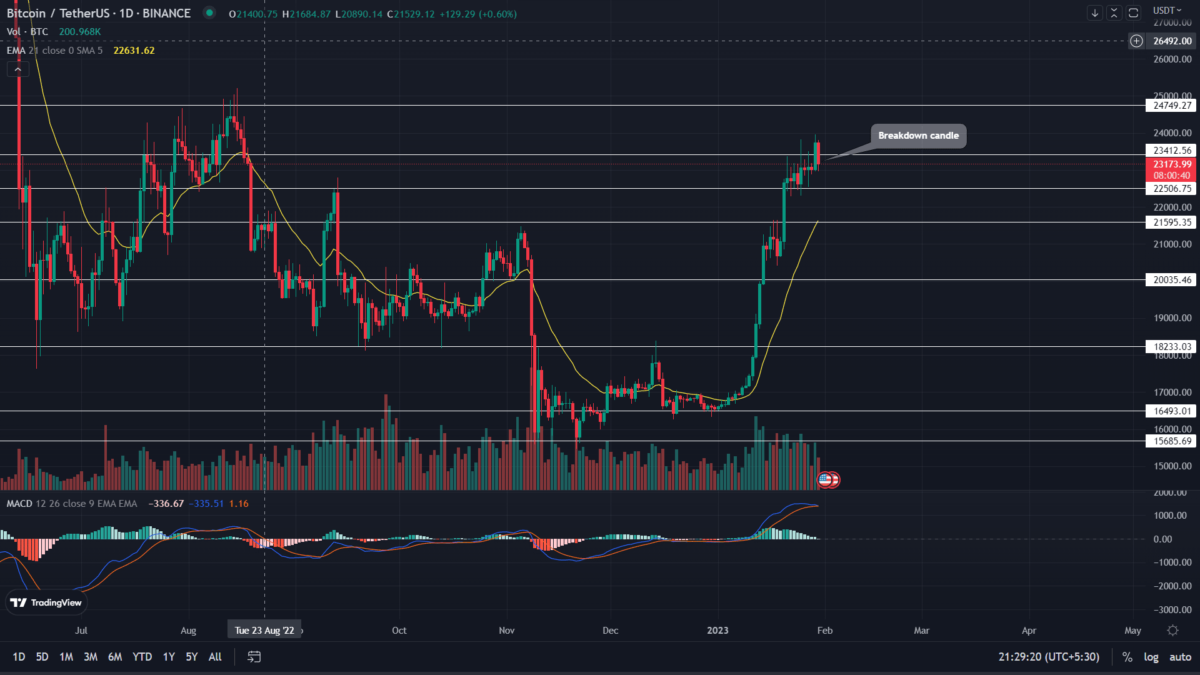
- A daily candle closing below the $23400 mark could trigger a longer correction in BTC
- Bitcoin’s fear and greed index at 61% indicates the market sentiment is still bullish
- The intraday trading volume in Bitcoin is $26.2 Billion, indicating a 2% gain
Source-Tradingview
During the fourth week of 2023, the Bitcoin price started resonating between the $23400 and $22500 levels. The daily candles showing long rejections on both ends indicated uncertainty among market participants. This indecisiveness could be backed by upcoming events such as interest rate hikes by the US Fed, Europe Central Bank, and Bank of England.
However, on January 29th, the Bitcoin price witnessed a significant inflow and breached the overhead resistance of $23400. This breakout hints at the release of bullish momentum and a higher chance for uptrend continuation.
Trending Stories
However, the Bitcoin price dropped 3% today and reenters the above-mentioned range. This downfall points to the prior breakout as a bull trap and a threatened coin price for a long correction.
Also Read: Top Crypto Discord Servers/Groups Worth Joining In 2023
If the daily candle closes below the $23400 mark, the BTC price will likely continue its consolidation in a narrow range or will dive deeper to revisit the $21600 or $19000 support. In addition, this downfall could force the liquidation of hasty buyers who entered on the $23400 breakout.
On a contrary note, if by the day’s end, the buyers push the candle closing above the $23400 mark, the bullish momentum will retain and drive the Bitcoin price higher.
Technical Indicator
MACD: the MACD(blue) and the signal(orange) lines on the verge of bearish crossover indicate the exhausted bullish momentum.
advertisement
EMAs: the reclaimed EMAs (20, 50, 100, and 200) could offer suitable support during a bearish pullback.
Bitcoin Price Intraday Levels
- Spot rate: $23176
- Trend: Bearish
- Volatility: High
- Resistance levels- $25000 and $28000
- Support levels- $22500 and $21500
Share this article on:
The presented content may include the personal opinion of the author and is subject to market condition. Do your market research before investing in cryptocurrencies. The author or the publication does not hold any responsibility for your personal financial loss.
- SEO Powered Content & PR Distribution. Get Amplified Today.
- Platoblockchain. Web3 Metaverse Intelligence. Knowledge Amplified. Access Here.
- Source: https://coingape.com/markets/bitcoin-price-dips-by-3-is-this-rally-a-bull-trap/

