After getting rejected from the $24K sentimental resistance area three times, the Bitcoin price finally broke the threshold, forming higher highs and lows on the daily chart. Can buyers expect to see the $27K level reached next?
Technical Analysis
By Shayan
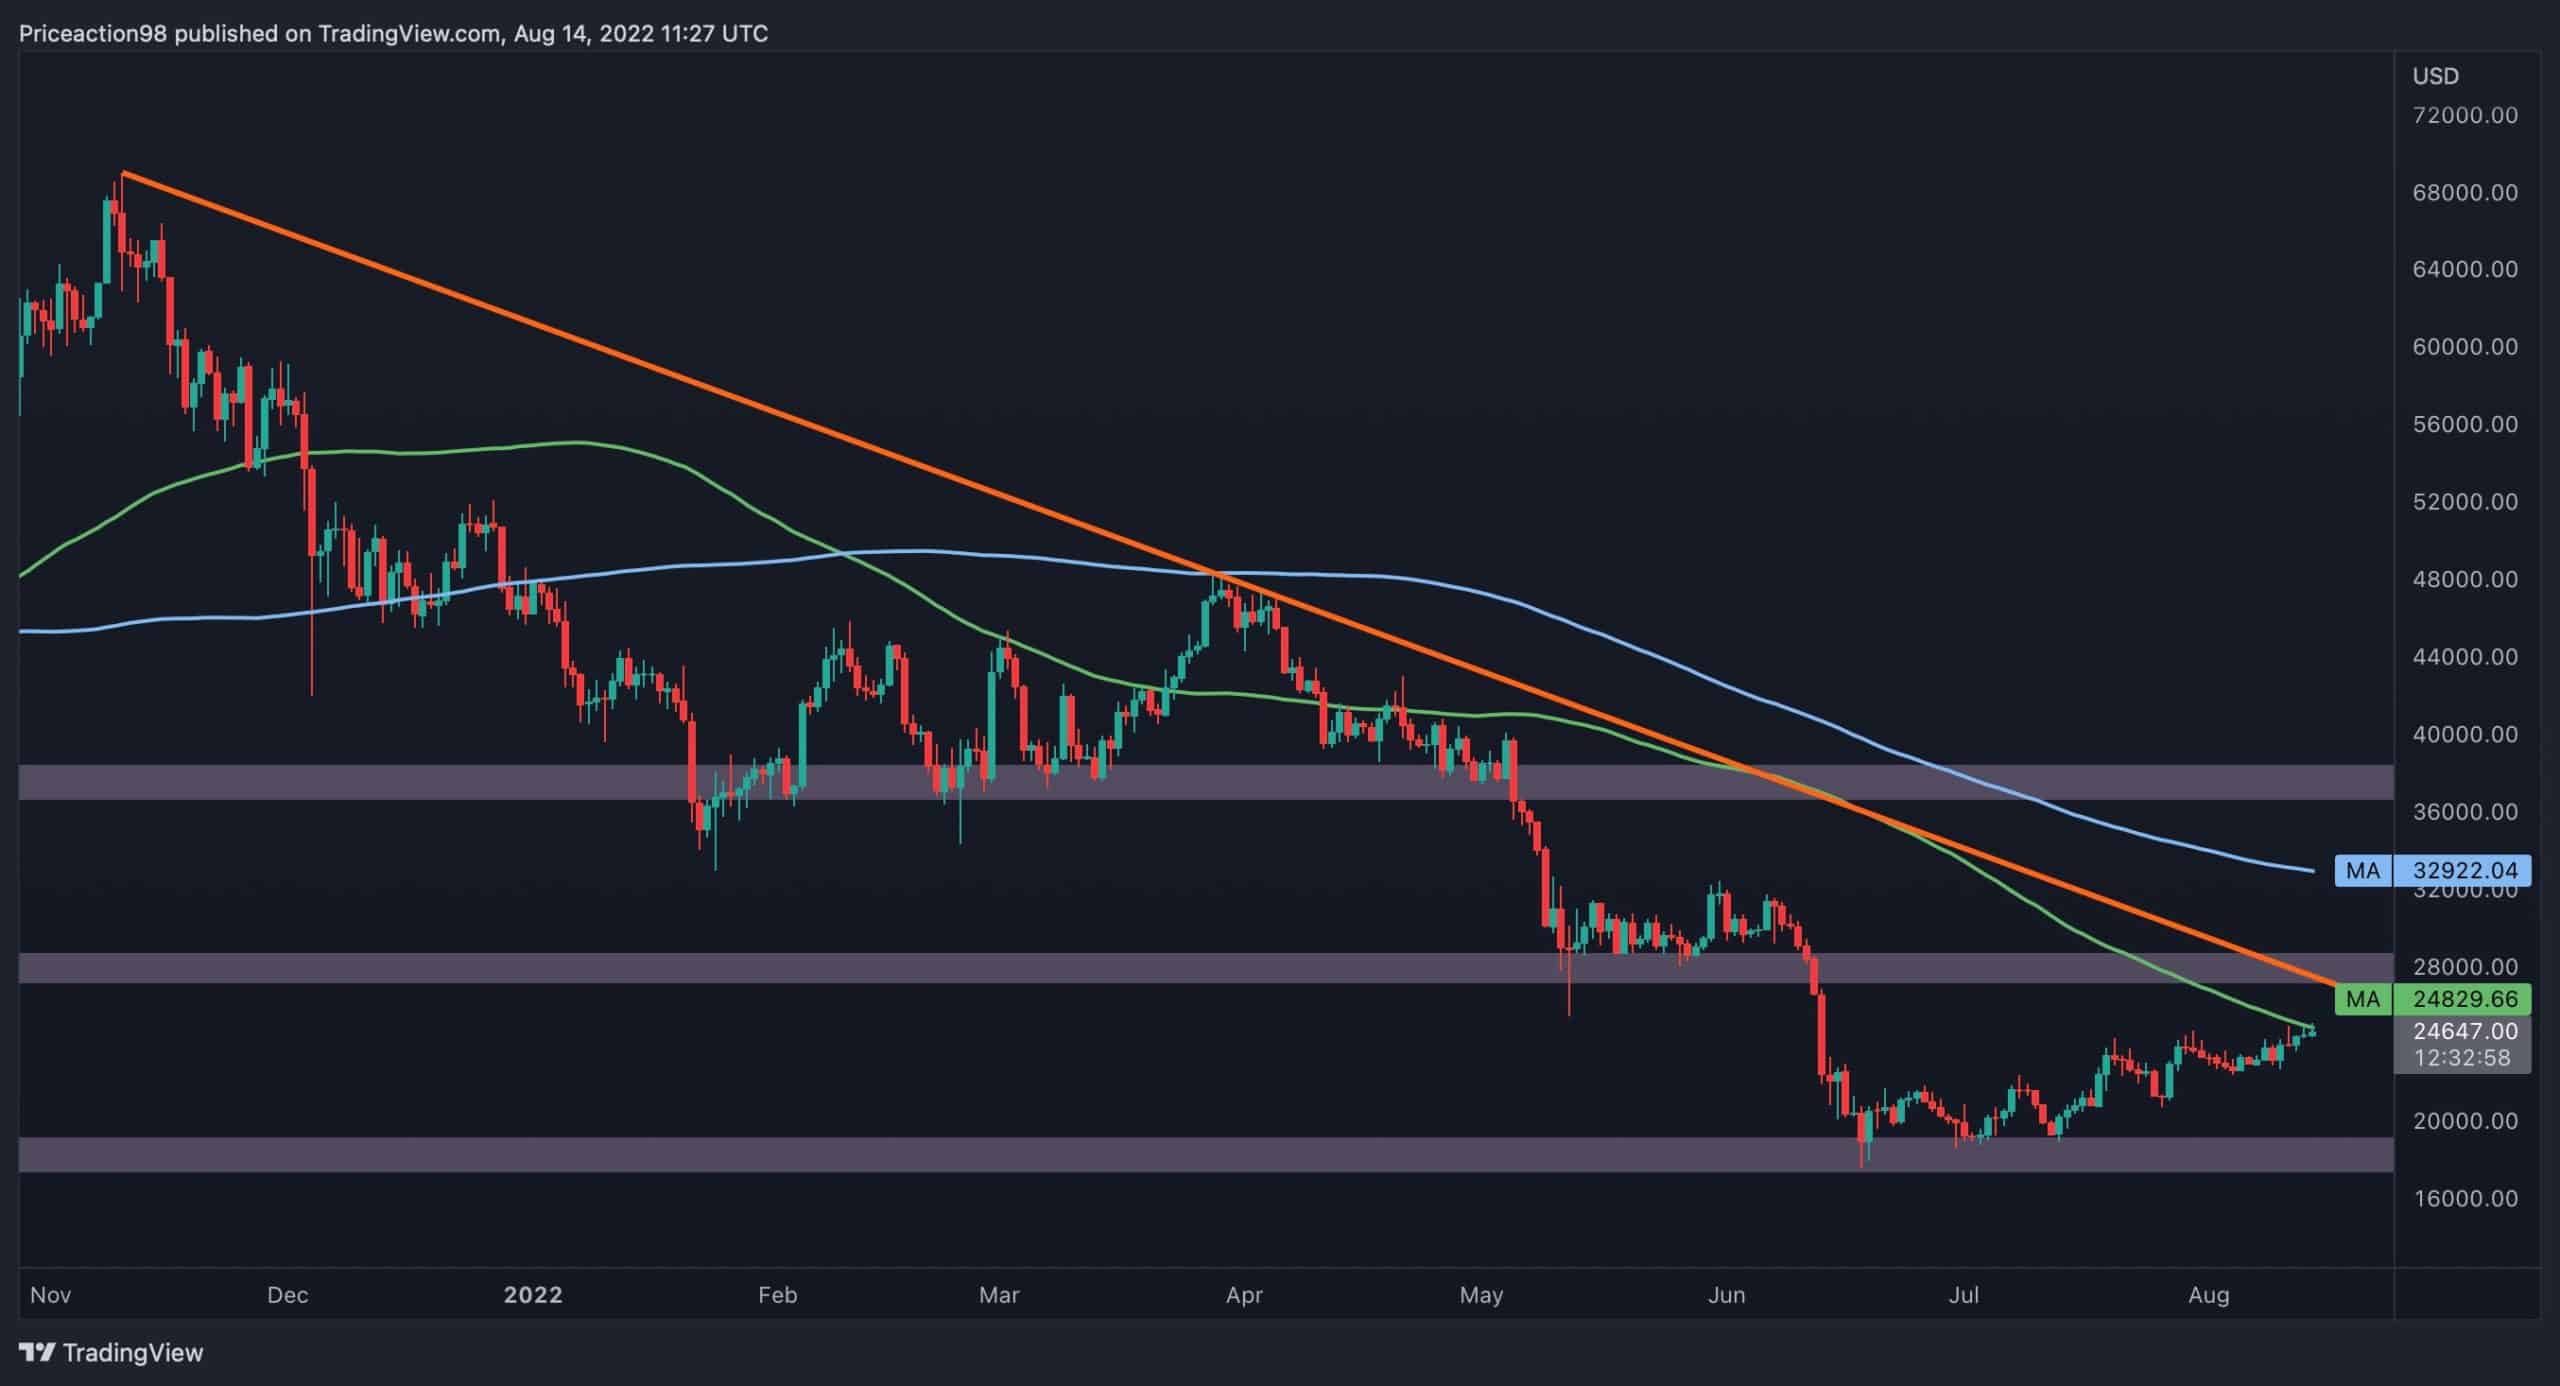
The Daily Chart
The weekly candle is closing tonight (Sunday’s midnight UTC), and if Bitcoin successfully closes above the $24K level, a rally toward the $27K region will be likely.
However, the 100-day moving average – a key support-resistance line – currently stands at roughly $25K, which is the current 2-month high set earlier today.
Nevertheless, the multi-month descending trendline and the $27K level will be the next major barriers for the primary cryptocurrency’s path in case of a successful breakout of the 100-day moving average line.
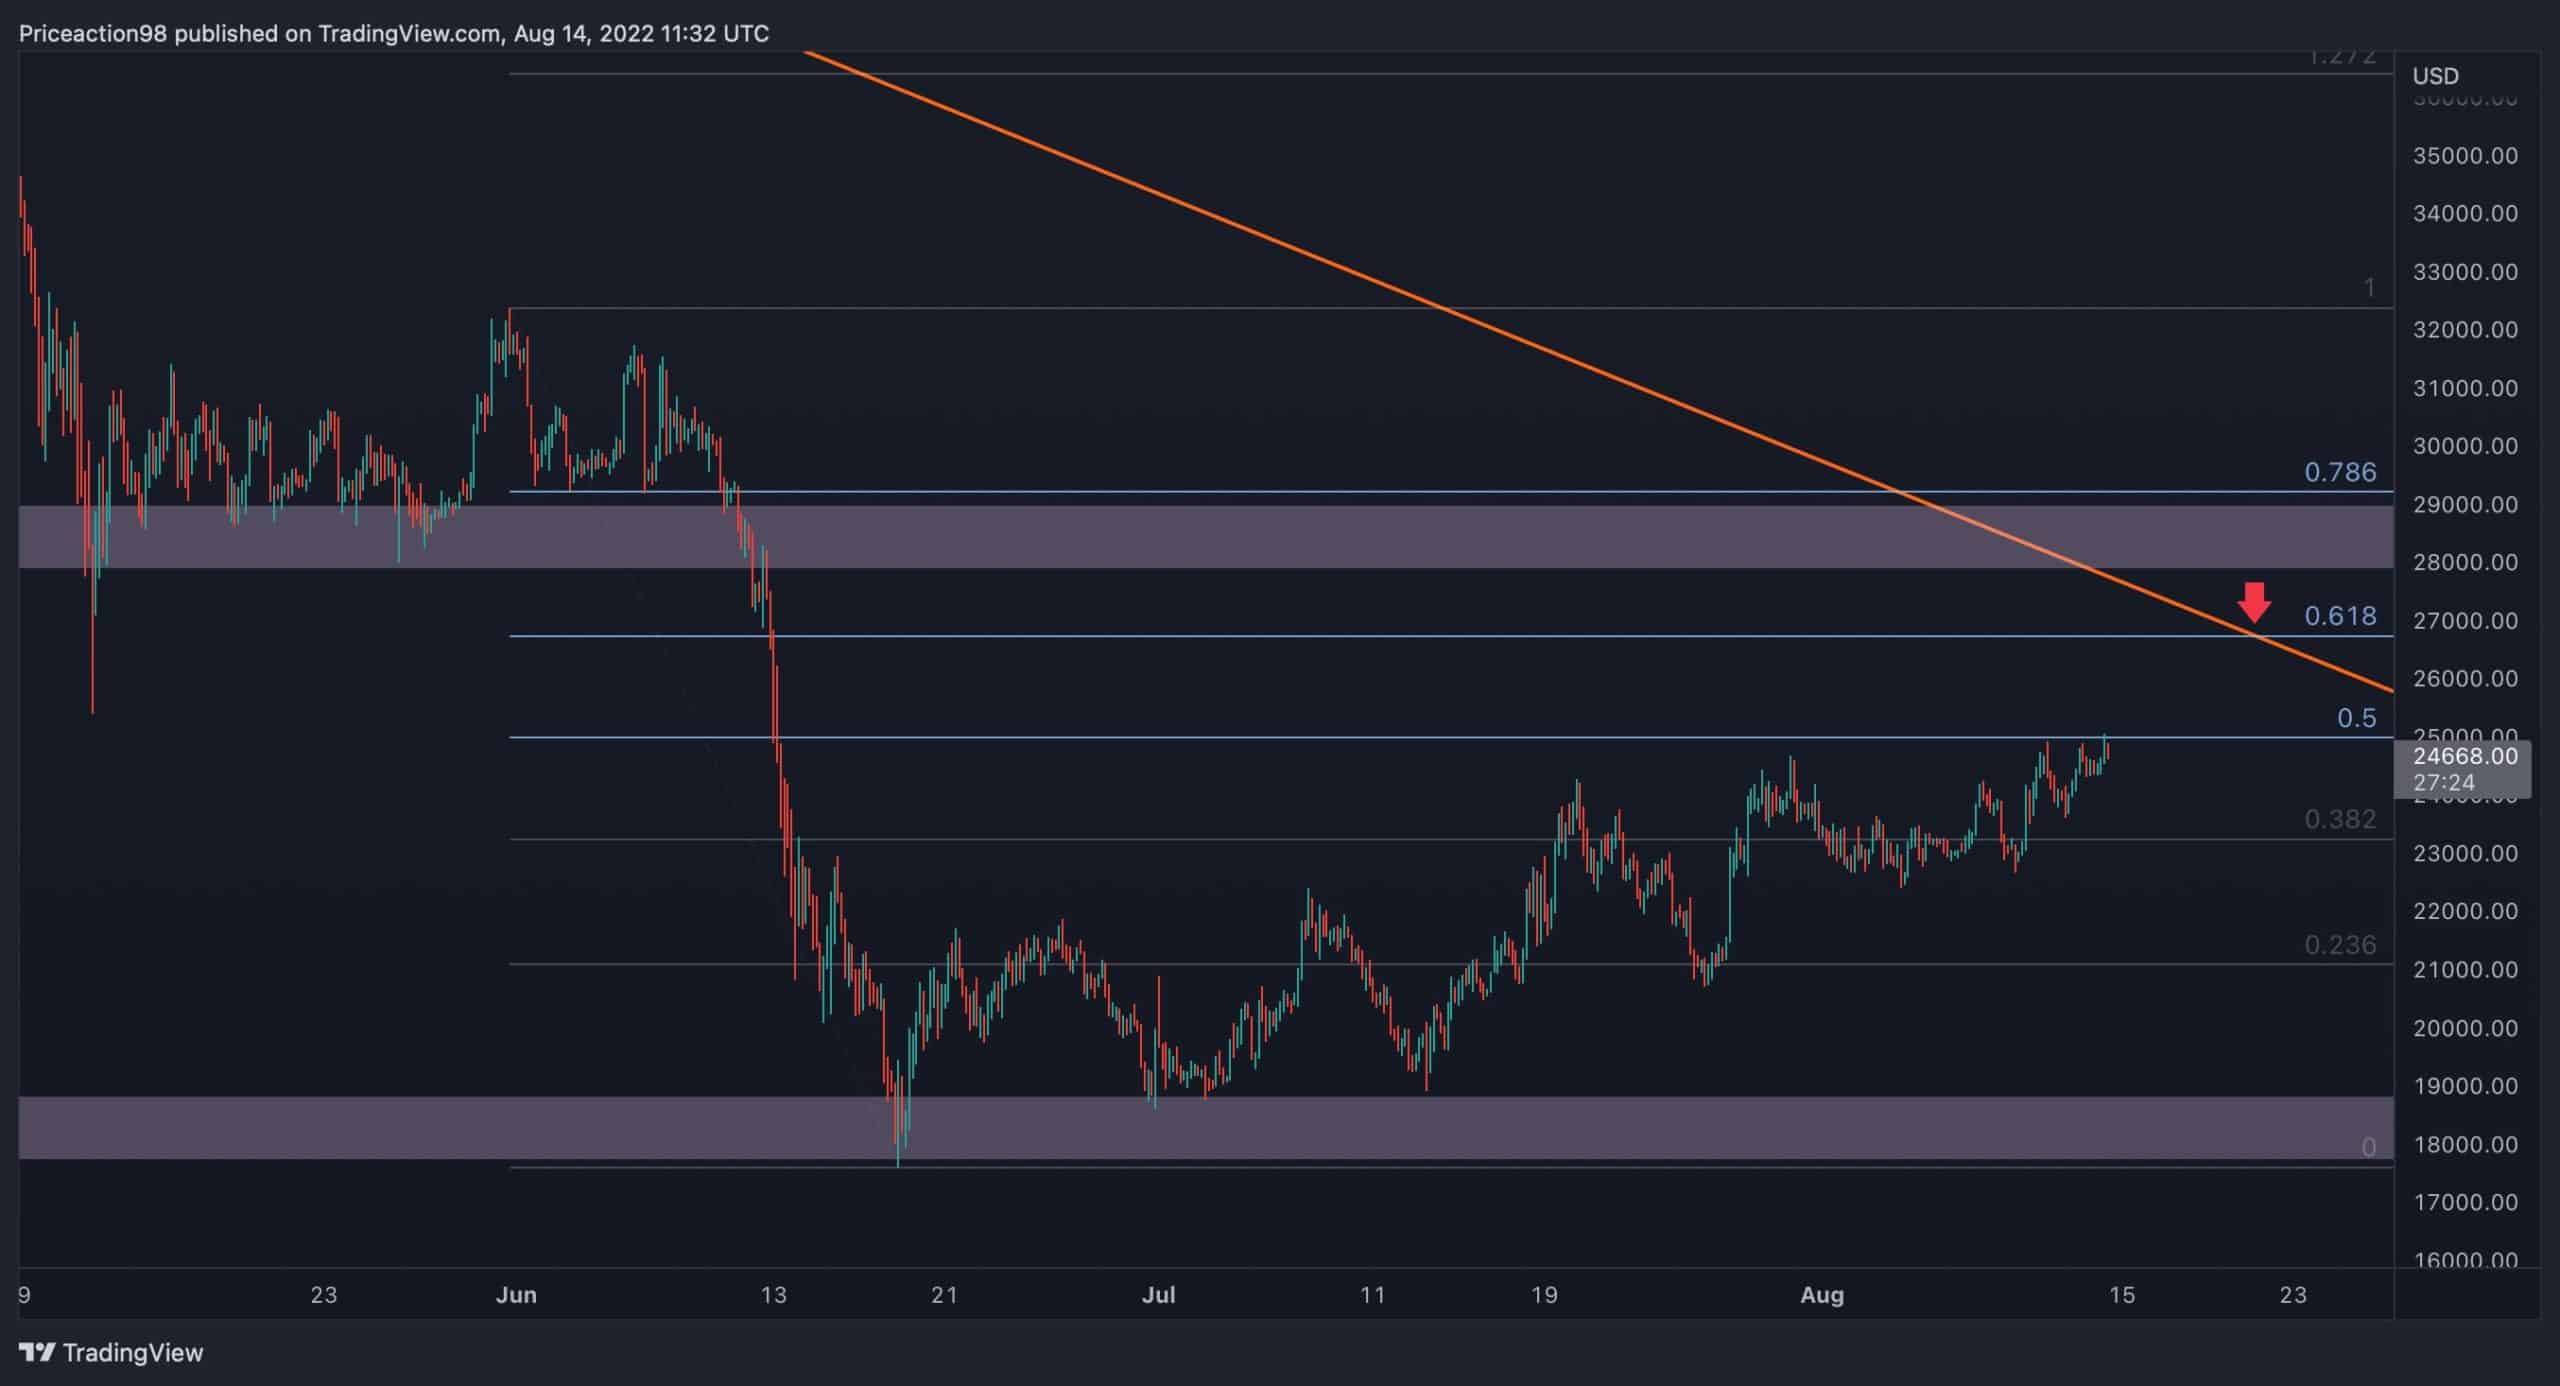
The 4-Hour Chart
As stated in our previous analysis, a healthy rally is always accompanied by short to mid-term correction stages. The price typically experiences a 50% – 61.8% correction during these correction phases.
These corrections are referred to as conventional Fibonacci retracement levels. The Fibonacci retracement’s 0.5 and 0.618 levels often serve as significant resistances for the price.
As of this writing, BTC has reached Fibonacci’s 0.5 level (approximately $25K). If Bitcoin successfully exceeds the threshold, the 0.618 level (at around $27K) will be a reachable target. Conversely, bearish momentum would probably return if it fails to break the 0.5 Fib level, and a downtrend toward the $20K support area will be probable.
Onchain Analysis
By Shayan
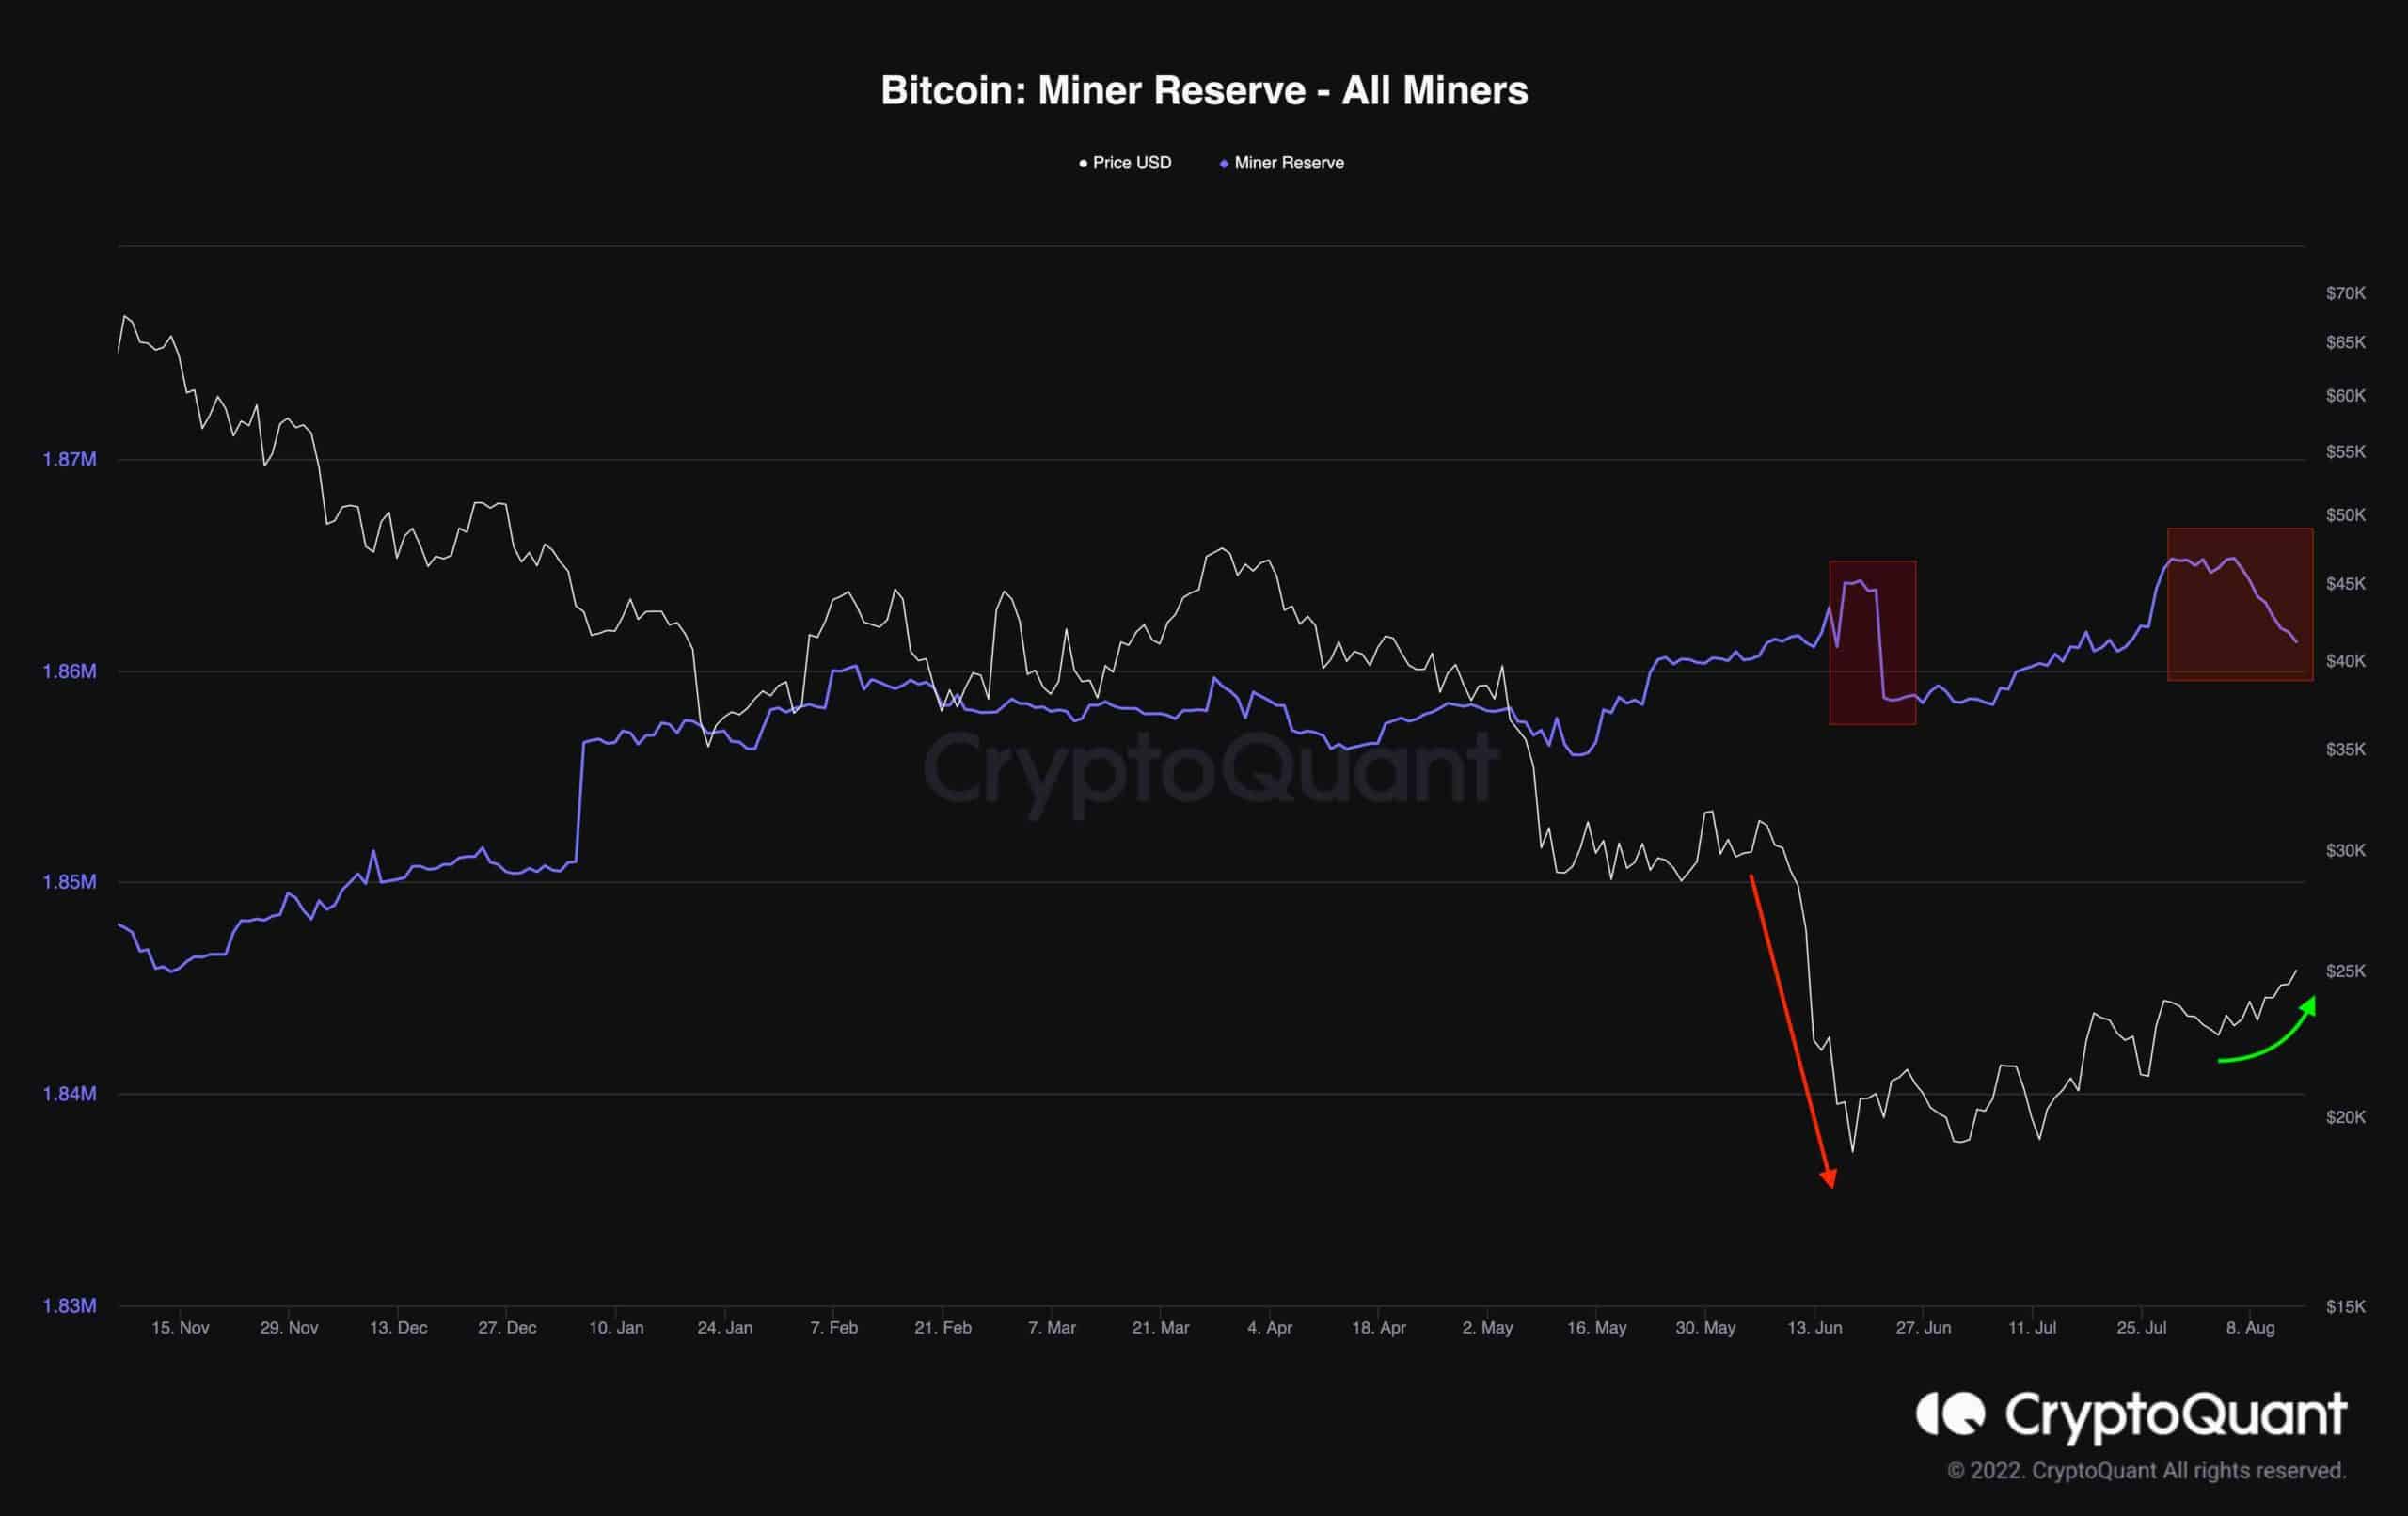
According to Onchain data provider CryptoQuant, the miners distributed the most substantial amount of Bitcoin in June 2022, when Bitcoin dropped below $20K.
They have been under pressure due to the subtractive profitability. In contrast, during the recent consolidation stage of the market between the $18K and $22K levels, the Miners’ Reserve was slowly increasing. These miners were forced to sell their Bitcoin to cover losses and lower their exposure to price instabilities.
However, Bitcoin’s price has rebounded towards the $25K level in the past few weeks. The Miners’ Reserve chart depicts that the miners have been distributing their assets since the recent rally. Accordingly, if this resumes, the selling pressure caused by forced sellers will possibly push the price lower in the short term, dropping to the $20K mark.
Binance Free $100 (Exclusive): Use this link to register and receive $100 free and 10% off fees on Binance Futures first month (terms).
PrimeXBT Special Offer: Use this link to register & enter POTATO50 code to receive up to $7,000 on your deposits.
Disclaimer: Information found on CryptoPotato is those of writers quoted. It does not represent the opinions of CryptoPotato on whether to buy, sell, or hold any investments. You are advised to conduct your own research before making any investment decisions. Use provided information at your own risk. See Disclaimer for more information.
Cryptocurrency charts by TradingView.

