Bitcoin is laggingly tailing the gold chart trends, and it may face trouble for its delayed correlation.
That is due to the precious metal’s latest breakdown move, wherein the price broke out of a Symmetrical Triangle pattern to the downside. Incidentally, Bitcoin is now consolidating inside a similar technical structure, and one analyst predicts it would break bearish just like gold.
“Since the COVID Crash of March 2020, it is apparent that gold has been leading Bitcoin,” the TradingView.com contributor wrote in his analysis, placing their performance against each other to prove the correlation theory.

Bitcoin-Gold trend comparison since March 2020, presented by Trader_Johnni. Source: TradingView.com
As shown in the chart above, the Gold bull run in March 2020 started before Bitcoin. The precious metal’s consolidation move in April 2020, too, paved the way for Bitcoin’s sideways trend that began in May 2020. Even the gold’s record high appeared more than a week before Bitcoin’s yearly one.
That left the analyst with ample evidence about a potential breakdown in the cryptocurrency market. The reason is simple: Gold has done the same after breaking bearish on its Symmetrical Triangle.
Studying Symmetrical Triangles
A Symmetrical Triangle is a continuation pattern, confirmed by two converging trendlines forming at least two lower highs and higher lows. It means that the price would likely undergo a breakout in the direction of its previous trend – though that is not always the case.
Both Bitcoin and gold formed a Symmetrical Triangle after rallying exponentially from their mid-March nadirs.
That would have ideally resulted in a bullish continuation trend. But the breakdown move on the gold charts invalidated the upside expectations. Therefore, the metal and the cryptocurrency are now targeting lower levels for a potential pullback.
Technically, the breakout target of a Symmetrical Triangle is as much as its maximum height.
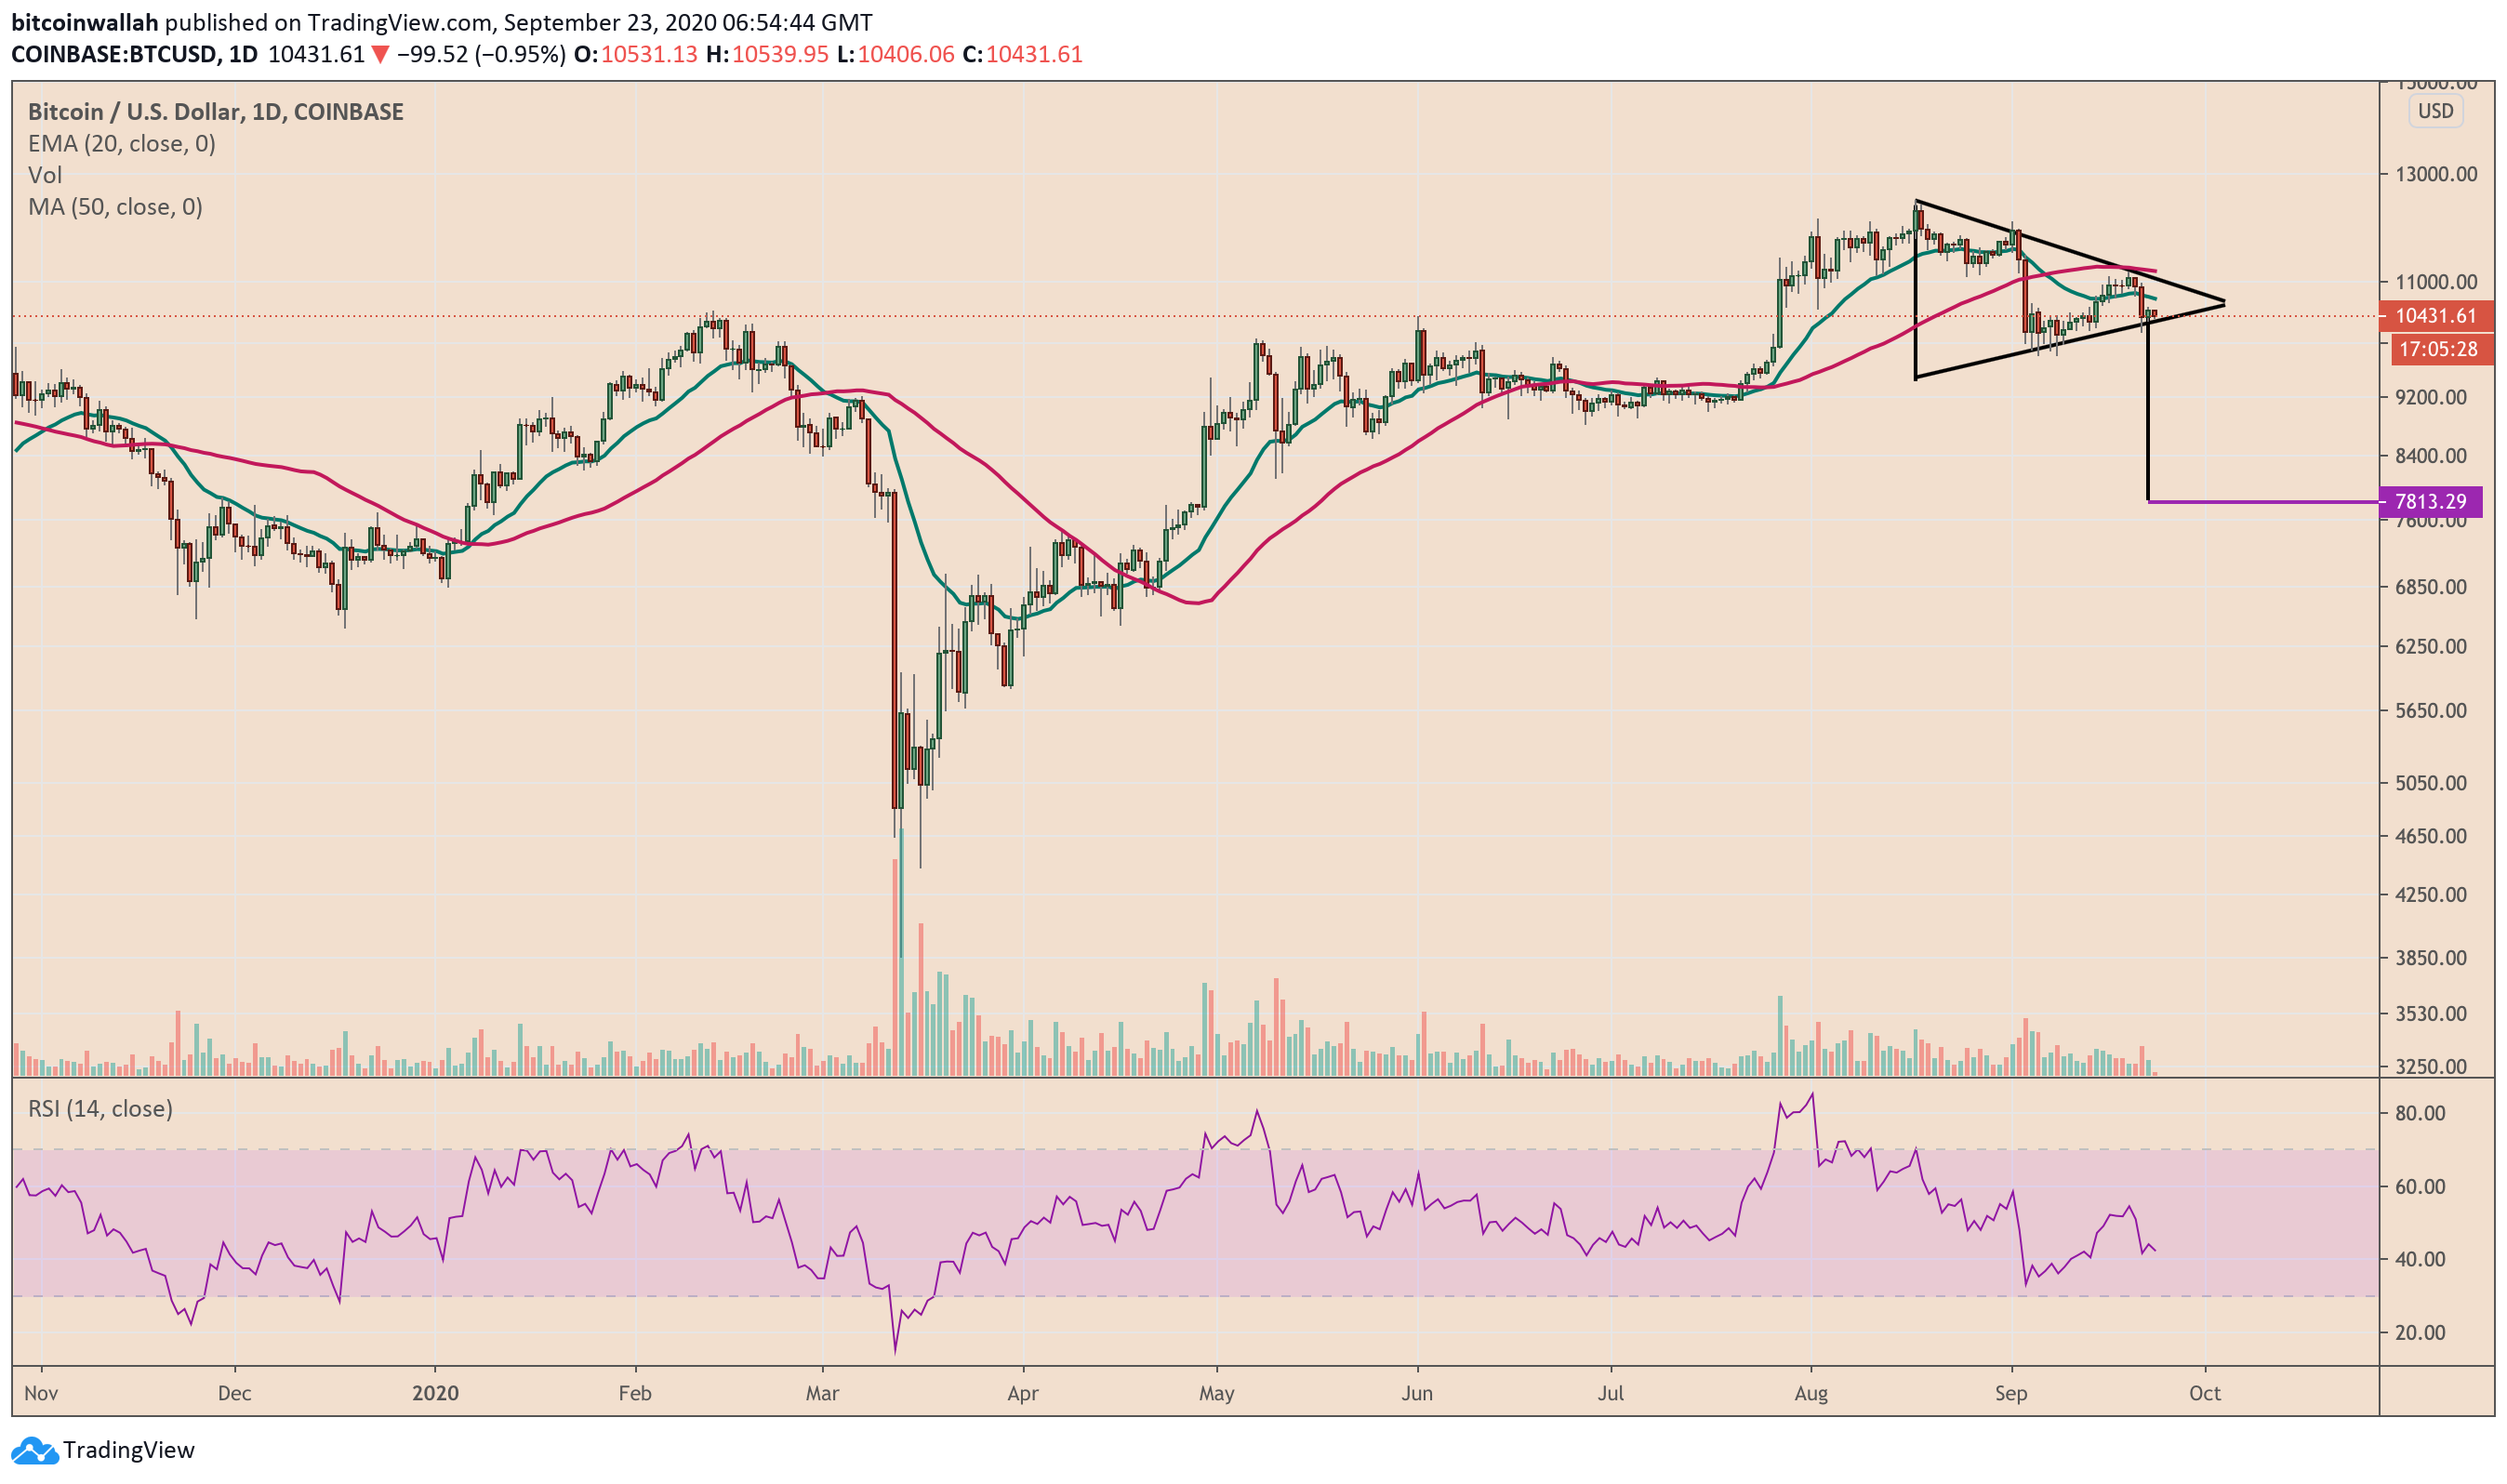
Bitcoin setup per the Symmetrical Triangle pattern. Source: TradingView.com
With gold breaking down, it now has a likelihood of trimming another $300 off its exchange rate – at most. Meanwhile, Bitcoin could fall by around $2,500 more, bringing its downside target somewhere near $7,800.
And the fundamentals agree.
Stronger Dollar, Delayed Stimulus, Weaker Bitcoin
The US dollar has lately put downward pressure on safe-haven and risky markets both. Its rebound from the two-year low reduced bids for Bitcoin, gold, and stocks, causing them all to correct lower in tandem.
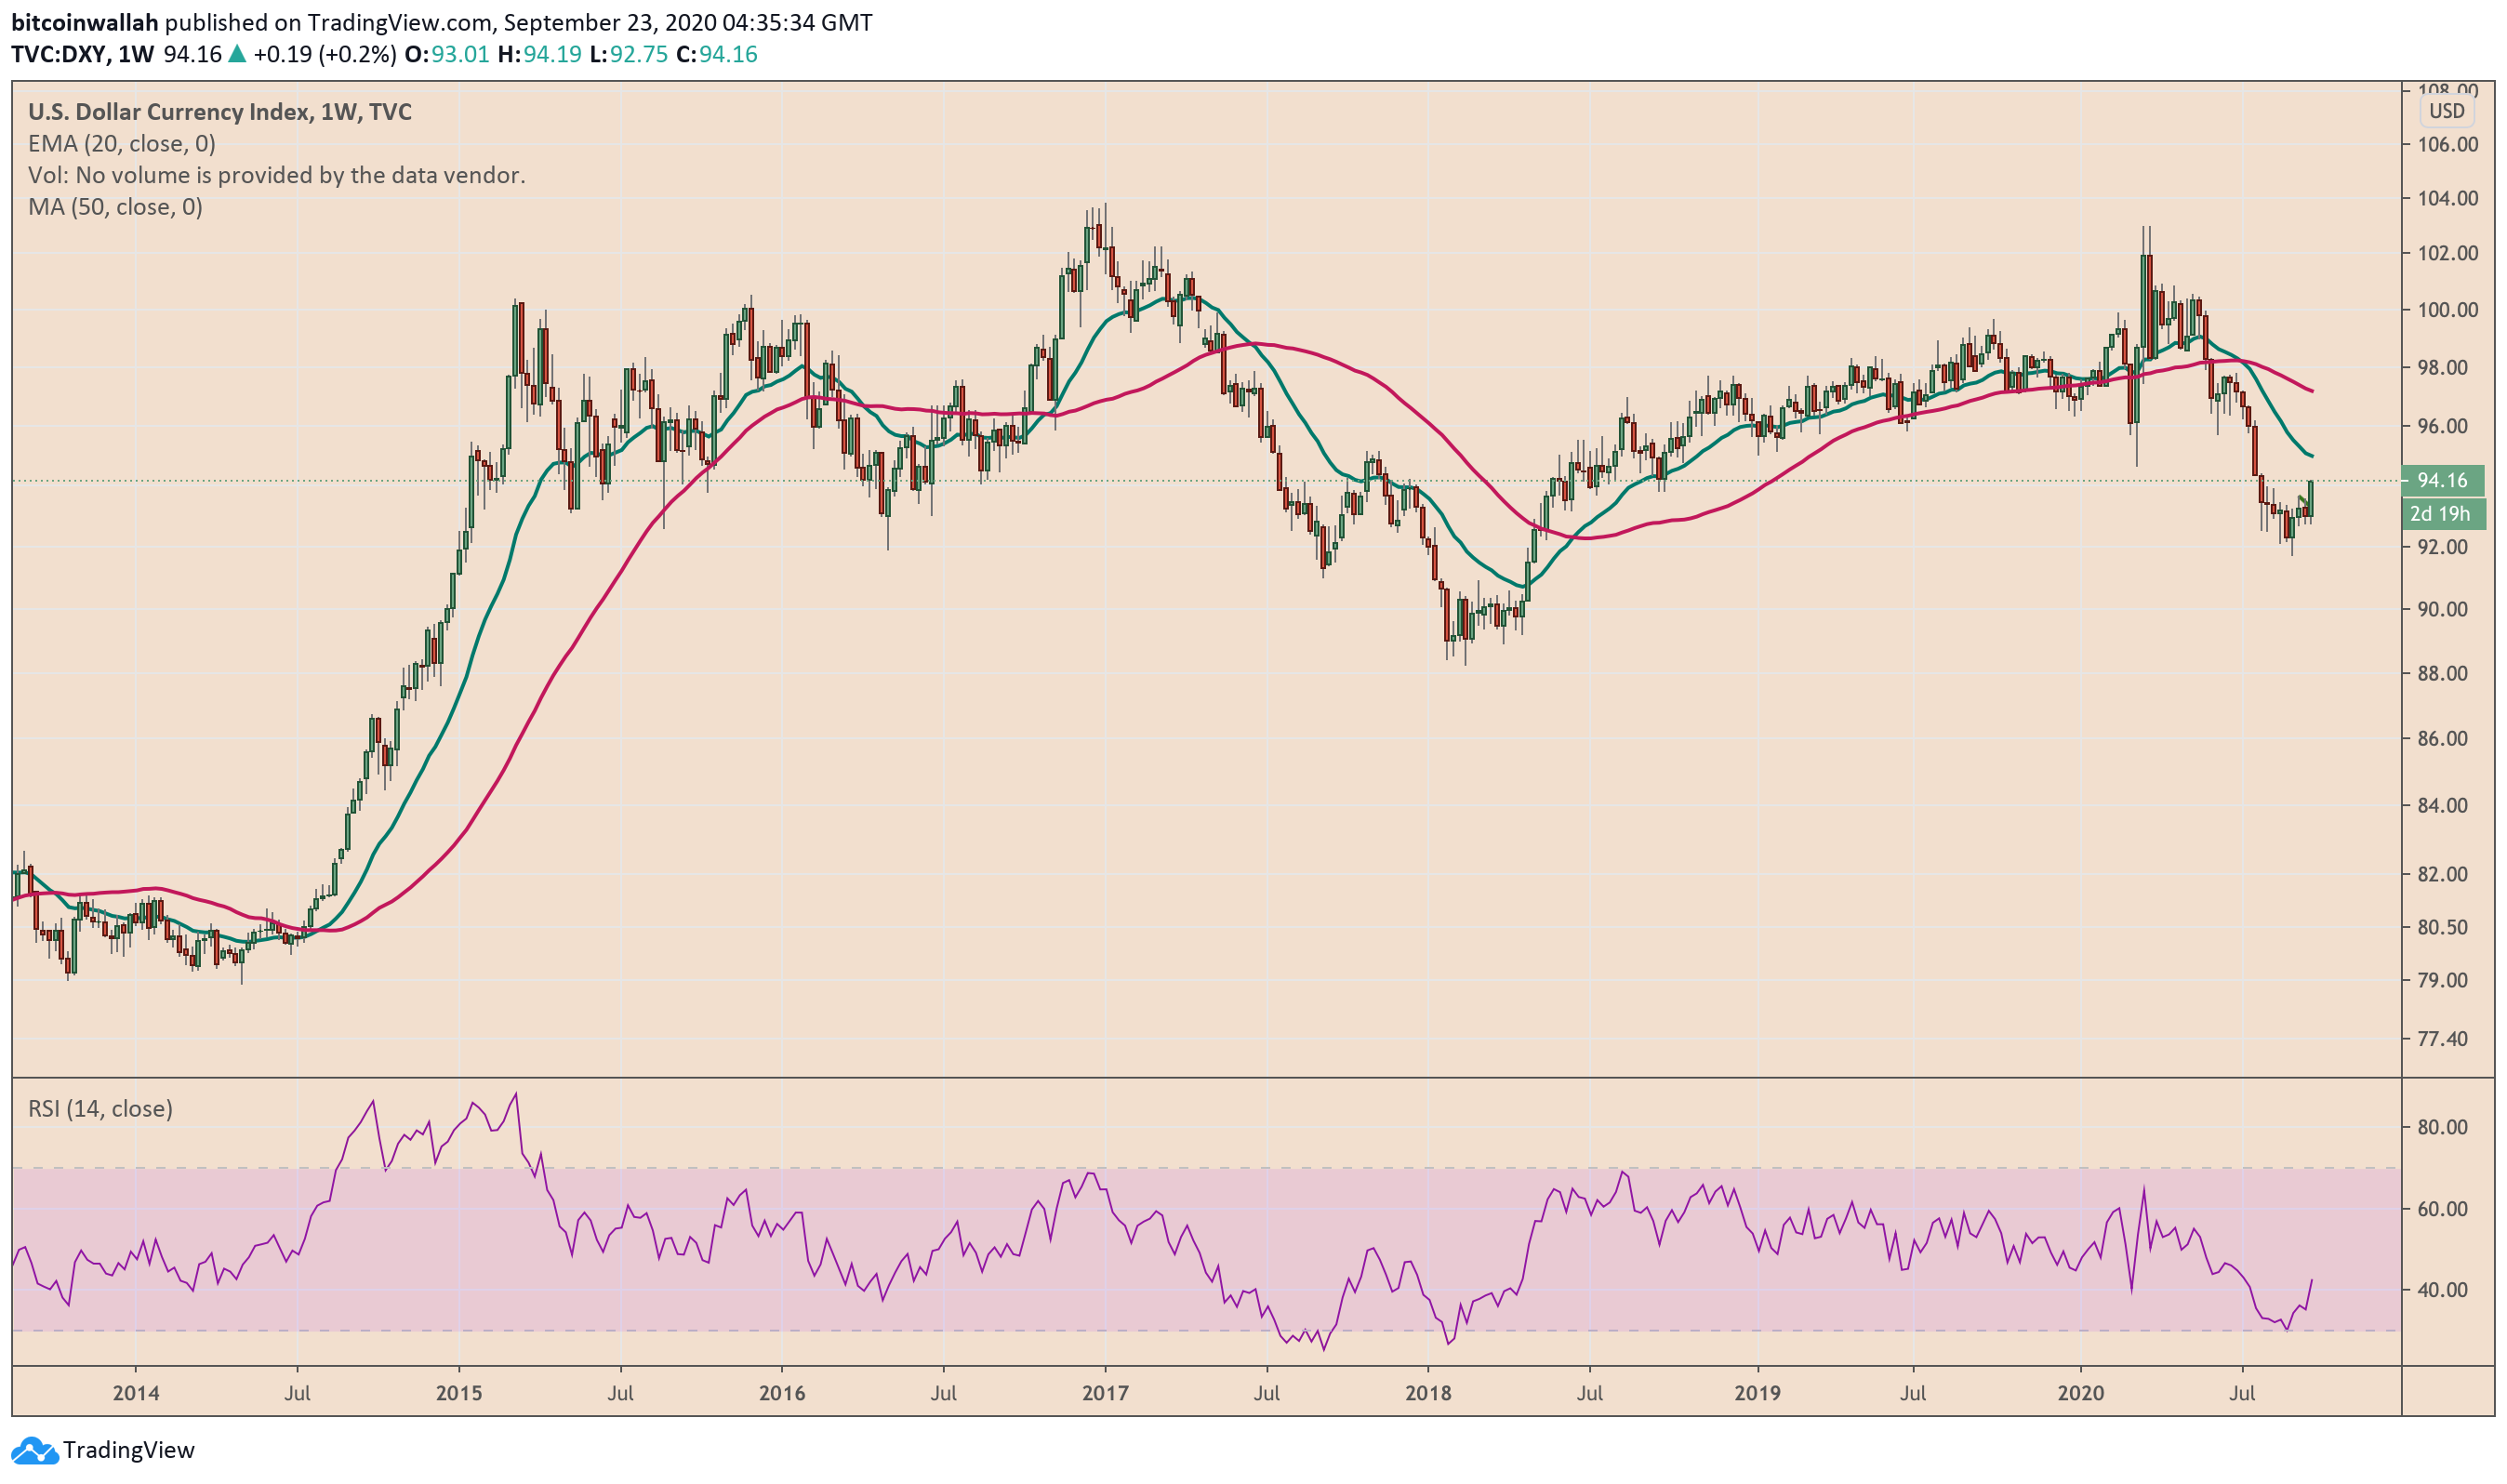
US Dollar Index (DXY) is up 1.25 percent on a week-to-date timeframe. Source: TradingView.com
A delay in the dispatching of the second COVID stimulus by the US Congress led investors spend-less-save-more strategy. Prospects of lesser-than-expected dollar liquidity increased its demand in the short-term, hurting other assets simultaneously.
Analysts think there won’t be a stimulus package until the US presidential elections in November. That would ensure Bitcoin and gold trades in sync in the coming sessions, with a downside bias.

