Amazon Redshift is a fast, fully managed, widely popular cloud data warehouse that powers the modern data architecture that empowers you with fast and deep insights and machine learning (ML) predictions using SQL across your data warehouse, data lake, and operational databases. A key differentiating factor of Amazon Redshift is its native integration with other AWS services, which makes it easy to build complete, comprehensive, and enterprise-level analytics applications. The AWS Analytics Automation Toolkit enables automatic provisioning and integration of not only Amazon Redshift, but database migration services like AWS Database Migration Service (AWS DMS) and the AWS Schema Conversion Tool (AWS SCT).
This post discusses new additions to the AWS Analytics Automation Toolkit, which enable you to perform advanced load testing on Amazon Redshift. This is accomplished by provisioning Apache JMeter as part of the analytics stack.
Solution overview
Apache JMeter is an open-source load testing application written in Java that you can use to load test web applications, backend server applications, databases, and more. In the database context, it’s an extremely valuable tool for repeating benchmark tests in a consistent manner, simulating concurrency workloads, and scalability testing on different database configurations.
For example, you can use JMeter to simulate a single business intelligence (BI) user or hundreds of BI users simultaneously running various SQL queries on an Amazon Redshift cluster for performance benchmarking, scalability, and throughput testing. Furthermore, you can rerun the same exact simulation on a different Amazon Redshift cluster that perhaps has twice as many nodes as the original cluster, to compare the price/performance ratio of each cluster.
Similarly, you can use JMeter to load test and assess the performance and throughput achieved for mixed extract, transform, and load (ETL) and BI workloads running on different Amazon Redshift cluster configurations.
For a deeper discussion of JMeter and its use for benchmarking Amazon Redshift, refer to Building high-quality benchmark tests for Amazon Redshift using Apache JMeter.
Although JMeter installation is a relatively straightforward process, consisting mainly of downloading and installing a Java virtual machine and JMeter, the thought of having to download, install, and set up any tool for benchmarking purposes can sometimes serve as a detractor for many. Starting from scratch for a test setup could also be intimidating.
The AWS Analytics Automation Toolkit now includes the option to automatically deploy JMeter on Amazon Elastic Compute Cloud (Amazon EC2) in the same virtual private cloud (Amazon VPC) as Amazon Redshift. This includes a dedicated Windows instance, with all required JMeter dependencies, such as JVM and a sample test plan, thereby easily enabling powerful load testing capabilities on Amazon Redshift. In this post, we demonstrate the use of the AWS Analytics Automation Toolkit for JMeter load tests on cloud benchmark data, using Amazon Redshift as a target environment.
This solution has the following features:
- It deploys resources automatically, including JMeter
- You can point JMeter to an existing Amazon Redshift cluster, or automatically create a new cluster
- You can bring your own data and queries, or use a sample TPC dataset
- You can easily customize the test plan into separate threads, each with different workloads and concurrency as needed
To use the AWS Analytics Automation Toolkit to run a JMeter load test, deploy the toolkit with the JMeter option, load data into your Amazon Redshift cluster, and customize the default test plan as you see fit.
The following diagram illustrates the solution architecture:
Prerequisites
Prior to deploying the AWS Analytics Automation Toolkit, complete the prerequisites and prepare the config file, user-config.json. For instructions, refer to Automate building an integrated analytics solution with AWS Analytics Automation Toolkit.
The config file has a new parameter called JMETER, at the top section. To provision a JMeter instance, enter the value CREATE for this parameter.
To provision a new Amazon Redshift cluster, enter the value CREATE for the REDSHIFT_ENDPOINT parameter. Then fill in values for the fields in the redshift section of the config file. You can use the sizing calculator on the Amazon Redshift console to recommend the correct cluster configuration based on your data size.
If you want load an industry-standard sample TPC-DS data (3TB) into your cluster, enter the value “Y” for the “loadTPCdata” parameter, under the redshift section.
To use an existing cluster, enter the endpoint of your cluster for the REDSHIFT_ENDPOINT parameter in the top section of the user-config.json file.

Deploy resources using the AWS Analytics Automation Toolkit
To deploy your resources, complete the following steps:
- Launch the toolkit as described in Automate building an integrated analytics solution with AWS Analytics Automation Toolkit.
- Create tables and ingest your test data into your Amazon Redshift cluster.
- If you chose to load the sample TPC-DS 3TB data, this will take some time to load, so please allow for this. If you are loading your own data then you may do that at this point.
Launch JMeter
To launch JMeter, complete the following steps:< /p>
- Using RDP, log in to the JMeter EC2 Windows instance created by the AWS Analytics Automation Toolkit.

- Launch the JMeter GUI by choosing (double-clicking) the shortcut JMETER on the Windows Desktop.
In our experience, changing the JMeter Look and Feel option to Windows (instead of dark mode) results in increased JMeter stability, so we highly recommend making that change and choosing Yes to restart the GUI.

Customize the JMeter test plan
To customize the JMeter test plan, we modify the JDBC connection, and optionally modify the thread ramp-up schedule and optimize the SQL.
- Using the JMeter GUI, open the AWS Analytics Automation Toolkit’s default test plan file
c:JMETERapache-jmeter-5.4.1Redshift Load Test.jmx. - Choose the test plan name and edit the
JdbcUservalue to the correct user name for your Amazon Redshift cluster.
If you used the CREATE cluster option, this value is the same as the master_user_name value in your user-config.json file.

- In JDBC connection, edit the
DatabaseURLvalue and password with the correct values for your cluster.
If you used the CREATE cluster option, the password is kept in a secret named <stackname>-RedshiftPassword. You can find the endpoint by choosing the new Amazon Redshift cluster and copying the endpoint value on the upper right.
This test plan already has a initialization command set to turn off the result cache feature of Amazon Redshift: set enable_result_cache_for_session to off. No action is needed to configure this.

- Optionally, modify the thread ramp-up schedule.
This test plan uses the Ultimate Thread Group, which is automatically installed when you open the test plan. Each thread group contains a ramp-up schedule, as well as a query or set of queries. Modify these to according to your testing preferences and dataset. If you loaded the TPCDS dataset, the queries included by default in the three thread groups will work.
In the following example, Smallthread Group has four rows, each of which launches the specific number of sessions at staggered timings. The ramp-up time to achieve the maximum session count is 45 seconds, because the last thread doesn’t start until 15 seconds into the test, and has a 30-second start time. You can adjust the ramp-up schedule, as well as the hold duration and shutdown time, by editing, adding, or deleting rows in the Thread Schedule section. The graph is then automatically adjusted.

- Optionally, you can customize the SQL.
In the following example, we choose the JDBC request item under the same SmallThread Group, called SmallSQL, and review the query run by this thread group. If you added your own data, insert the query or queries you want to run for this thread group. Do the same for the medium and large thread groups, or delete or add thread groups as needed.

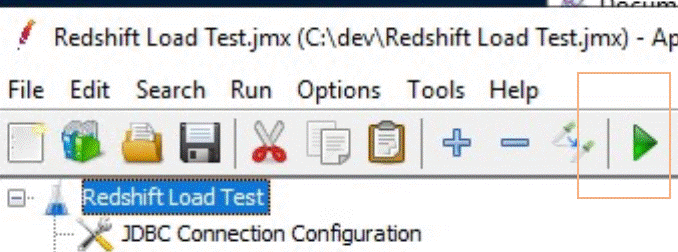
Run the test
Run the test plan by choosing the green arrow in the GUI.
Alternatively, enter the following command in a Windows command prompt to run JMeter in command line mode:
Use case example: Evaluating concurrency scaling benefits
For our example use case, we want to determine how Amazon Redshift concurrency scaling benefits our workload performance. We can use the JMeter setup outlined in this post to quickly answer this question.
In the following example, we ran the sample test plan as is against the sample TPC-DS data, with 80 concurrent users across three thread groups. We ran the test first with concurrency scaling enabled, then reran it after disabling concurrency scaling on the Amazon Redshift cluster.
To monitor the results, open the Amazon Redshift console, choose Clusters in the navigation pane, and choose the cluster you’re using for the performance test. On the Cluster performance tab, you can monitor the CPU utilization of all the nodes in your cluster, as shown in the following screenshot.

On the Query monitoring tab, you ca
n monitor the queue activity, as well as concurrency scaling activity of your cluster.

The preceding graphs cover two different tests with a 4-node ra3.16xlarge cluster. On the left side, concurrency scaling was enabled for the cluster, and on the right side it was disabled. In the test with concurrency scaling enabled, the queueing is less, and test completion duration is shorter.
Note that the test duration is the time to run the workload on Amazon Redshift, not to download query results.
Lastly, to review the actual test result query performance, you can download the file C:JMETERapache-jmeter-5.4.1SummaryReportIndividualRecords.csv from the EC2 instance, and review the query performance for each thread. The following screenshot is a summary plot of the test results for this example, with and without concurrency scaling.

As the chart illustrates, concurrency scaling can significantly reduce the latency for your workloads, and is particularly useful for short bursts of activity on your application.
Conclusion
JMeter allows you to create a flexible and powerful load test for your Amazon Redshift clusters to assess the performance of the cluster. With the new capability in the AWS Analytics Automation Toolkit, you can provision and configure JMeter, along with a test plan, in a fraction of the time it would normally take.
About the Authors
 Samir Kakli is an Analytics POC Specialist Solutions Architect based out of Florida. He is focused on helping customers quickly and effectively align Amazon Redshift’s capabilities to their business needs.
 Asser Moustafa is an Analytics Specialist Solutions Architect at AWS based out of Dallas, Texas. He advises customers in the Americas on their Amazon Redshift and data lake architectures and migrations, starting from the POC stage to actual production deployment and maintenance.

