
Image by Author
In today’s article, I’ll focus on Python skills for data science. A data scientist without Python is like a writer without a pen. Or a typewriter. Or a laptop. OK, how about this: A data scientist without Python is like me without an attempt at humor.
You can know Python and not be a data scientist. But the other way around? Let me know if you know someone who made it in data science without Python. In the last 20 years, that is.
To help you practice Python and interviewing skills, I selected three Python coding interview questions. Two are from StrataScratch, and are the type of questions that require using Python to solve a specific business problem. The third question is from LeetCode, and tests how good you are at Python algorithms.

Image by Author
Take a look at this question by Google.
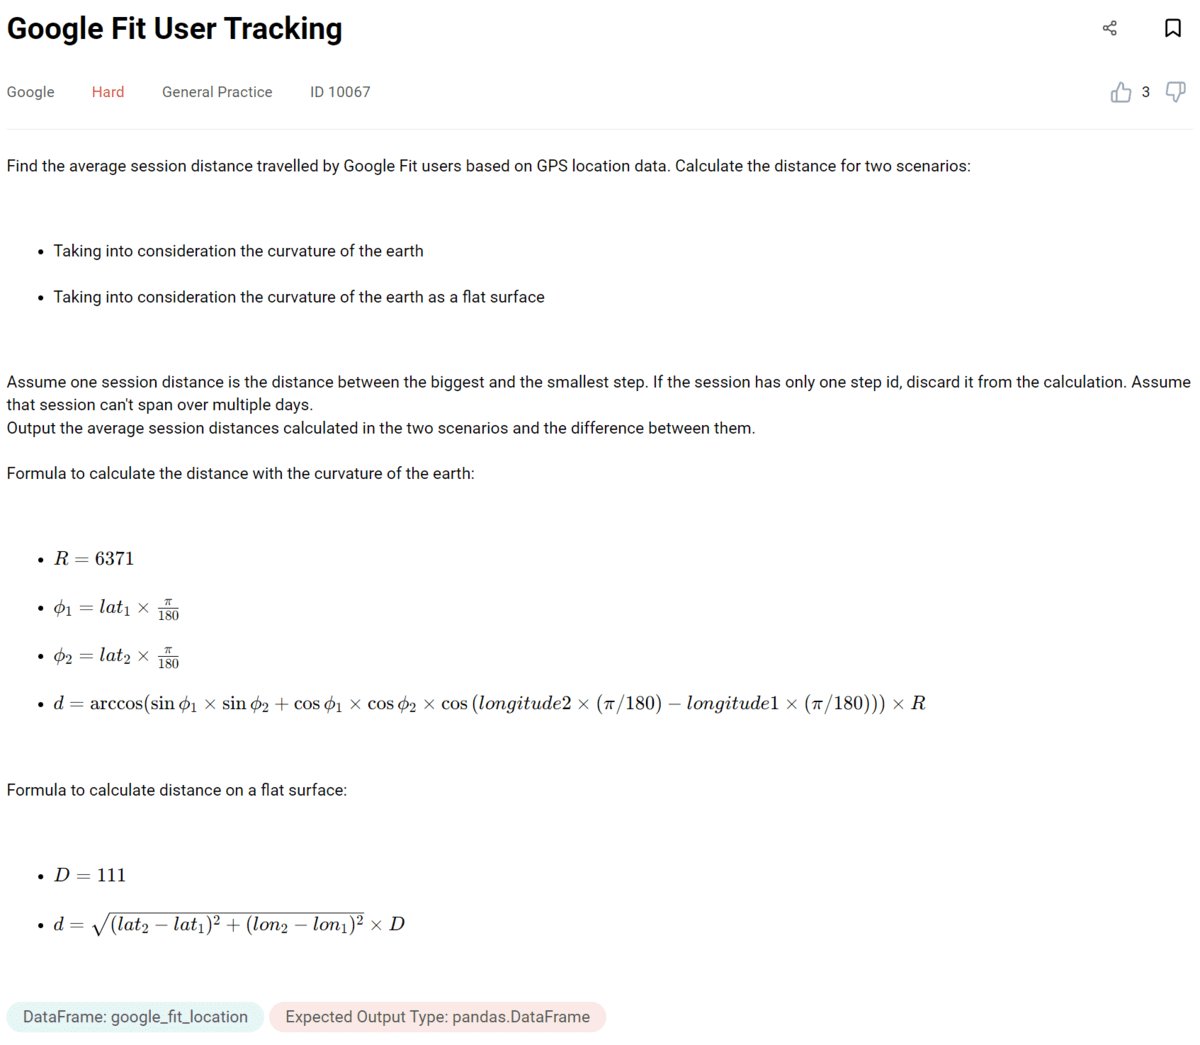
Link to the question: https://platform.stratascratch.com/coding/10067-google-fit-user-tracking
Your task is to calculate the average distance based on GPS data using the two approaches. One is taking into consideration the curvature of the Earth, the other is not taking it into consideration.
The question gives you formulas for both approaches. As you can see, this python coding interview question is math-heavy. Not only do you need to understand this level of mathematics, but you also need to know how to translate it into a Python code.
Not that easy, right?
The first thing you should do is recognize there’s a math Python module that gives you access to the mathematical functions. You’ll use this module a lot in this question.
Let’s start by importing necessary libraries and sine, cosine, arccosine, and radian functions. The next step is to merge the available DataFrame with itself on the user ID, session ID, and day of the session. Also, add the suffixes to IDs so you can distinguish between them.
import numpy as np
import pandas as pd
from math import cos, sin, acos, radians df = pd.merge( google_fit_location, google_fit_location, how="left", on=["user_id", "session_id", "day"], suffixes=["_1", "_2"],
)
Then find the difference between the two step IDs.
df['step_var'] = df['step_id_2'] - df['step_id_1']
The previous step was necessary so we can exclude all the sessions that have only one step ID in the next step. That’s what the questions tell us to do. Here’s how to do it.
df = df.loc[ df[df["step_var"] > 0] .groupby(["user_id", "session_id", "day"])["step_var"] .idxmax()
]
Use the pandas idxmax() function to access the sessions with the biggest difference between the steps.
After we prepared the dataset, now comes the mathematics part. Create a pandas Series and then the for loop. Use the iterrows() method to calculate the distance for each row, i.e., session. This is a distance that takes the Earth’s curvature into account, and the code reflects the formula given in the question.
df["distance_curvature"] = pd.Series()
for i, r in df.iterrows(): df.loc[i, "distance_curvature"] = ( acos( sin(radians(r["latitude_1"])) * sin(radians(r["latitude_2"])) + cos(radians(r["latitude_1"])) * cos(radians(r["latitude_2"])) * cos(radians(r["longitude_1"] - r["longitude_2"])) ) * 6371 )
Now, do the same thing but considering the Earth is flat. This is the only occasion being a flat-Earther is beneficial.
df["distance_flat"] = pd.Series()
for i, r in df.iterrows(): df.loc[i, "distance_flat"] = ( np.sqrt( (r["latitude_2"] - r["latitude_1"]) ** 2 + (r["longitude_2"] - r["longitude_1"]) ** 2 ) * 111 )
Turn the result into a DataFrame and start calculating the output metrics. The first one is the average distance with Earth’s curvature. Then the same calculation without the curvature. The final metric is the difference between the two.
result = pd.DataFrame()
result["avg_distance_curvature"] = pd.Series(df["distance_curvature"].mean())
result["avg_distance_flat"] = pd.Series(df["distance_flat"].mean())
result["distance_diff"] = result["avg_distance_curvature"] - result["avg_distance_flat"]
result
The complete code, and its result are given below.
import numpy as np
import pandas as pd
from math import cos, sin, acos, radians df = pd.merge( google_fit_location, google_fit_location, how="left", on=["user_id", "session_id", "day"], suffixes=["_1", "_2"],
)
df["step_var"] = df["step_id_2"] - df["step_id_1"]
df = df.loc[ df[df["step_var"] > 0] .groupby(["user_id", "session_id", "day"])["step_var"] .idxmax()
] df["distance_curvature"] = pd.Series()
for i, r in df.iterrows(): df.loc[i, "distance_curvature"] = ( acos( sin(radians(r["latitude_1"])) * sin(radians(r["latitude_2"])) + cos(radians(r["latitude_1"])) * cos(radians(r["latitude_2"])) * cos(radians(r["longitude_1"] - r["longitude_2"])) ) * 6371 )
df["distance_flat"] = pd.Series()
for i, r in df.iterrows(): df.loc[i, "distance_flat"] = ( np.sqrt( (r["latitude_2"] - r["latitude_1"]) ** 2 + (r["longitude_2"] - r["longitude_1"]) ** 2 ) * 111 )
result = pd.DataFrame()
result["avg_distance_curvature"] = pd.Series(df["distance_curvature"].mean())
result["avg_distance_flat"] = pd.Series(df["distance_flat"].mean())
result["distance_diff"] = result["avg_distance_curvature"] - result["avg_distance_flat"]
result
| avg_distance_curvature | avg_distance_flat | distance_diff |
| 0.077 | 0.088 | -0.01 |

Image by Author
This is one of the very interesting Python coding interview questions from StrataScratch. It puts you in a very common yet complex situation of a real-life data scientist.
It’s a question by Delta Airlines. Let’s take a look at it.

Link to the question: https://platform.stratascratch.com/coding/2008-the-cheapest-airline-connection
This question asks you to find the cheapest airline connection with a maximum of two stops. This sounds awfully familiar, doesn’t it? Yes, it’s a somewhat modified shortest path problem: instead of a path, there’s cost instead.
The solution I’ll show you extensively uses the merge() pandas function. I’ll also use itertools for looping. After importing all the necessary libraries and modules, the first step is to generate all the possible combinations of the origin and destination.
import pandas as pd
import itertools df = pd.DataFrame( list( itertools.product( da_flights["origin"].unique(), da_flights["destination"].unique() ) ), columns=["origin", "destination"],
)
Now, show only combinations where the origin is different from the destination.
df = df[df['origin'] != df['destination']]
Let’s now merge the da_flights with itself. I’ll use the merge() function, and the tables will be joined from the left on the destination and the origin. That way, you get all the direct flights to the first destination and then the connecting flight whose origin is the same as the first flight’s destination.
connections_1 = pd.merge( da_flights, da_flights, how="left", left_on="destination", right_on="origin", suffixes=["_0", "_1"],
)
Then we merge this result with da_flights. That way, we’ll get the third flight. This equals two stops, which is the maximum allowed by the question.
connections_2 = pd.merge( connections_1, da_flights[["origin", "destination", "cost"]], how="left", left_on="destination_1", right_on="origin", suffixes=["", "_2"],
).fillna(0)
Let’s now tidy the merge result by assigning the logical column names and calculate the cost of the flights with one and two stops. (We already have the costs of the direct flights!). It’s easy! The total cost of the one-stop flight is the first flight plus the second flight. For the two-stop flight, it’s a sum of the costs for all three flights.
connections_2.columns = [ "id_0", "origin_0", "destination_0", "cost_0", "id_1", "origin_1", "destination_1", "cost_1", "origin_2", "destination_2", "cost_2",
]
connections_2["cost_v1"] = connections_2["cost_0"] + connections_2["cost_1"]
connections_2["cost_v2"] = ( connections_2["cost_0"] + connections_2["cost_1"] + connections_2["cost_2"]
)
I will now merge the DataFrame I created with the given DataFrame. This way, I’ll be assigning the costs of each direct flight.
result = pd.merge( df, da_flights[["origin", "destination", "cost"]], how="left", on=["origin", "destination"],
)
Next, merge the above result with connections_2 to get the costs for the flights to destinations requiring one stop.
result = pd.merge( result, connections_2[["origin_0", "destination_1", "cost_v1"]], how="left", left_on=["origin", "destination"], right_on=["origin_0", "destination_1"],
)
Do the same for the two-stop flights.
result = pd.merge( result, connections_2[["origin_0", "destination_2", "cost_v2"]], how="left", left_on=["origin", "destination"], right_on=["origin_0", "destination_2"],
)
The result of this is a table giving you costs from one origin to a destination with direct, one-stop, and two-stop flights. Now you only need to find the lowest cost using the min() method, remove the NA values and show the output.
result["min_price"] = result[["cost", "cost_v1", "cost_v2"]].min(axis=1)
result[~result["min_price"].isna()][["origin", "destination", "min_price"]]
With these final lines of code, the complete solution is this.
import pandas as pd
import itertools df = pd.DataFrame( list( itertools.product( da_flights["origin"].unique(), da_flights["destination"].unique() ) ), columns=["origin", "destination"],
)
df = df[df["origin"] != df["destination"]] connections_1 = pd.merge( da_flights, da_flights, how="left", left_on="destination", right_on="origin", suffixes=["_0", "_1"],
)
connections_2 = pd.merge( connections_1, da_flights[["origin", "destination", "cost"]], how="left", left_on="destination_1", right_on="origin", suffixes=["", "_2"],
).fillna(0)
connections_2.columns = [ "id_0", "origin_0", "destination_0", "cost_0", "id_1", "origin_1", "destination_1", "cost_1", "origin_2", "destination_2", "cost_2",
]
connections_2["cost_v1"] = connections_2["cost_0"] + connections_2["cost_1"]
connections_2["cost_v2"] = ( connections_2["cost_0"] + connections_2["cost_1"] + connections_2["cost_2"]
) result = pd.merge( df, da_flights[["origin", "destination", "cost"]], how="left", on=["origin", "destination"],
) result = pd.merge( result, connections_2[["origin_0", "destination_1", "cost_v1"]], how="left", left_on=["origin", "destination"], right_on=["origin_0", "destination_1"],
) result = pd.merge( result, connections_2[["origin_0", "destination_2", "cost_v2"]], how="left", left_on=["origin", "destination"], right_on=["origin_0", "destination_2"],
)
result["min_price"] = result[["cost", "cost_v1", "cost_v2"]].min(axis=1)
result[~result["min_price"].isna()][["origin", "destination", "min_price"]]
Here’s the code output.
| origin | destination | min_price |
| SFO | JFK | 400 |
| SFO | DFW | 200 |
| SFO | MCO | 300 |
| SFO | LHR | 1400 |
| DFW | JFK | 200 |
| DFW | MCO | 100 |
| DFW | LHR | 1200 |
| JFK | LHR | 1000 |

Image by Author
Besides graphs, you’ll also work with binary trees as a data scientist. That’s why it would be useful if you knew how to solve this Python coding interview question asked by likes of DoorDash, Facebook, Microsoft, Amazon, Bloomberg, Apple, and TikTok.

Link to the question: https://leetcode.com/problems/binary-tree-maximum-path-sum/description/
The constraints are:
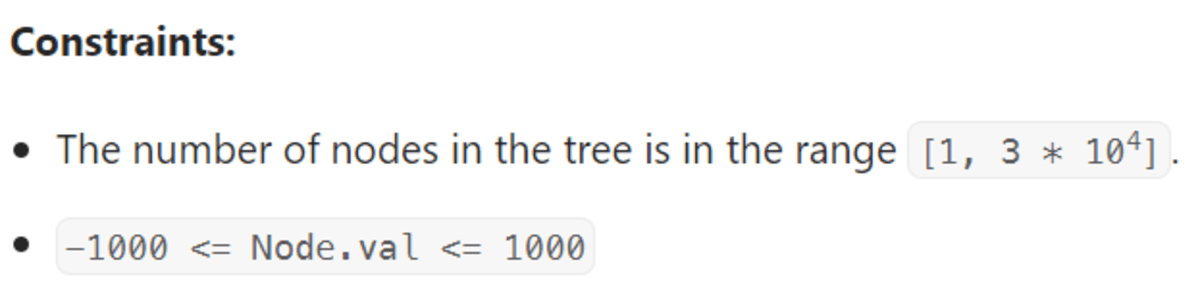
class Solution: def maxPathSum(self, root: Optional[TreeNode]) -> int: max_path = -float("inf") def gain_from_subtree(node: Optional[TreeNode]) -> int: nonlocal max_path if not node: return 0 gain_from_left = max(gain_from_subtree(node.left), 0) gain_from_right = max(gain_from_subtree(node.right), 0) max_path = max(max_path, gain_from_left + gain_from_right + node.val) return max(gain_from_left + node.val, gain_from_right + node.val) gain_from_subtree(root) return max_path
The first step towards the solution is defining a maxPathSum function. To determine if there is a path from the root down the left or right node, write the recursive function gain_from_subtree.
The first instance is the root of a subtree. If the path is equal to a root (no child nodes), then the gain from a subtree is 0. Then do the recursion in the left and the right node. If the path sum is negative, the question asks not to take it into account; we do that by setting it to 0.
Then compare the sum of the gains from a subtree with the current maximum path and update it if necessary.
Finally, return the path sum of a subtree, which is a maximum of the root plus the left node and the root plus the right node.
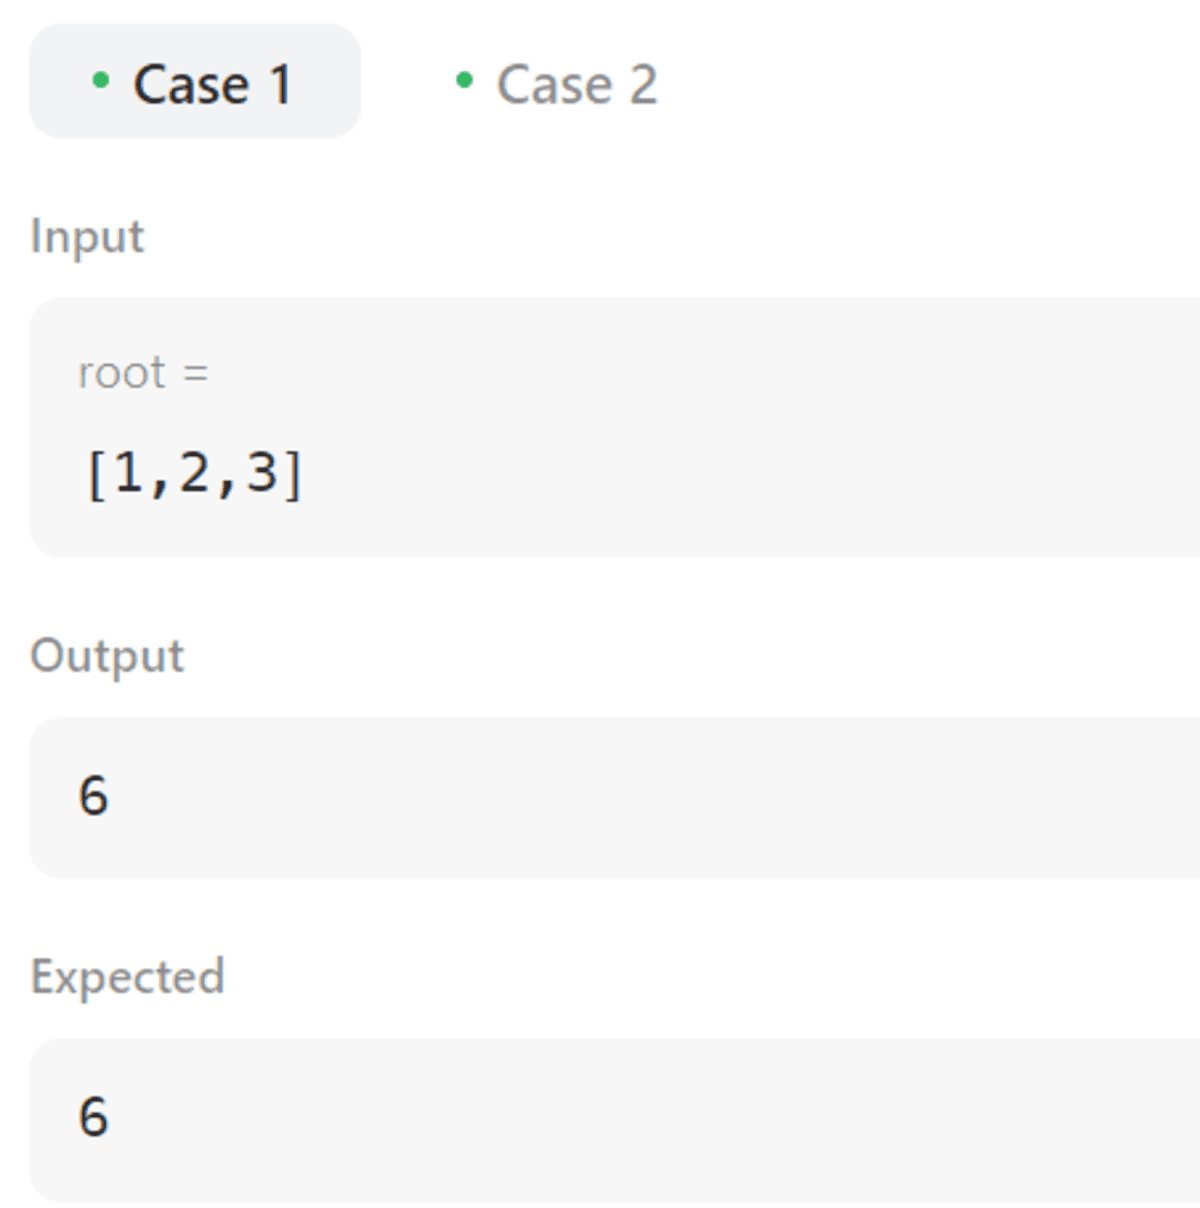
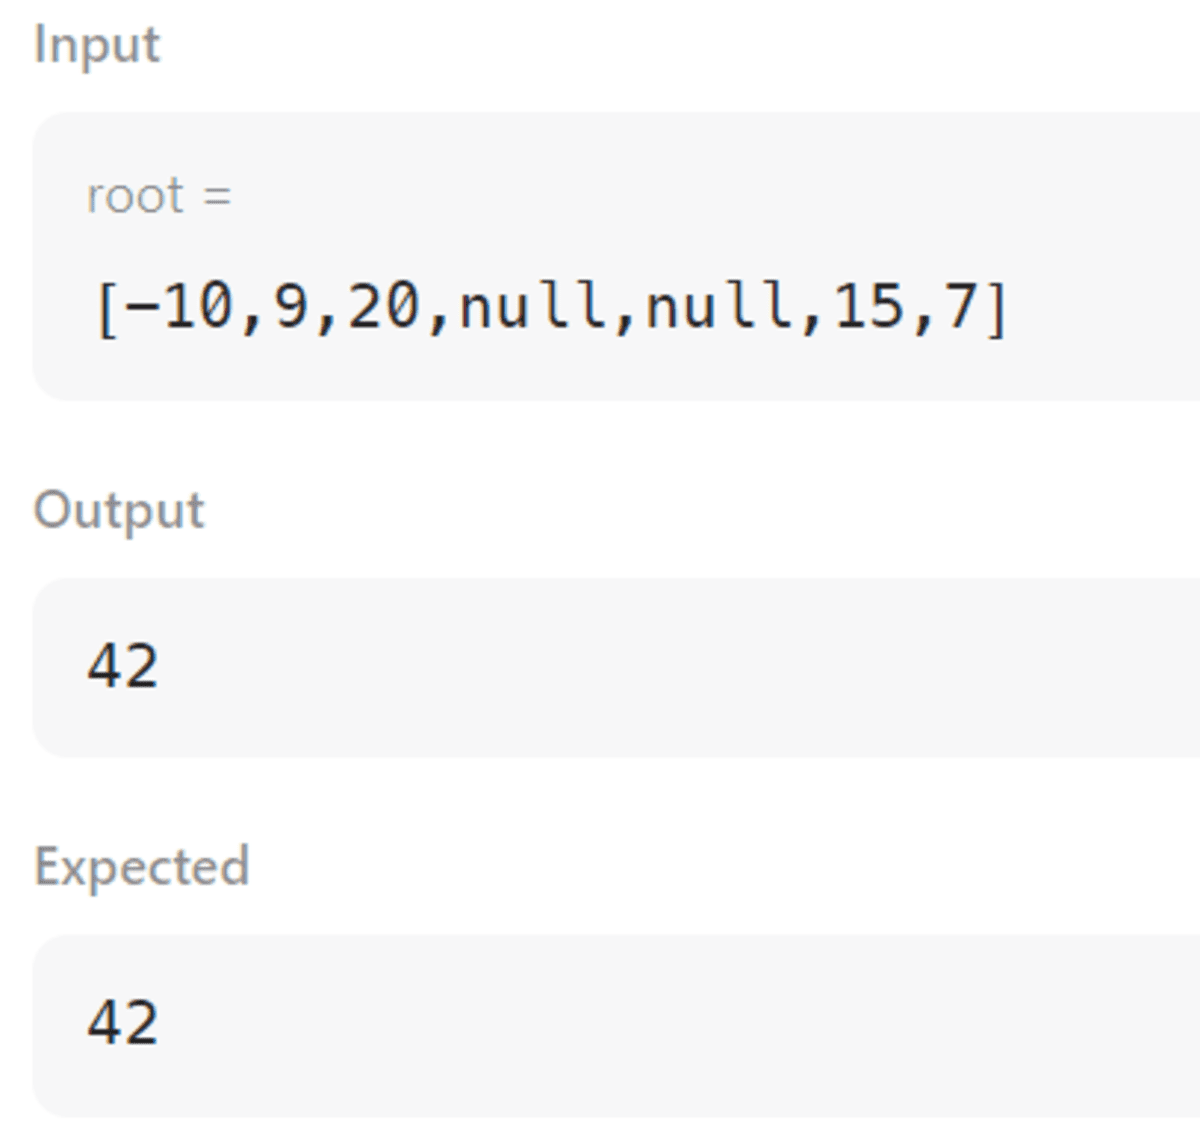
These are the outputs for Cases 1 & 2.
Summary
This time, I wanted to give you something different. There are plenty of Python concepts you should know as a data scientist. This time I decided to cover three topics I don’t see that often: mathematics, graph data structures, and binary trees.
The three questions I showed you seemed ideal for showing you how to translate these concepts into Python code. Check out “Python coding interview questions” to practice such more Python concepts.
Nate Rosidi is a data scientist and in product strategy. He’s also an adjunct professor teaching analytics, and is the founder of StrataScratch, a platform helping data scientists prepare for their interviews with real interview questions from top companies. Connect with him on Twitter: StrataScratch or LinkedIn.
- SEO Powered Content & PR Distribution. Get Amplified Today.
- Platoblockchain. Web3 Metaverse Intelligence. Knowledge Amplified. Access Here.
- Source: https://www.kdnuggets.com/2023/03/3-hard-python-coding-interview-questions-data-science.html?utm_source=rss&utm_medium=rss&utm_campaign=3-hard-python-coding-interview-questions-for-data-science

